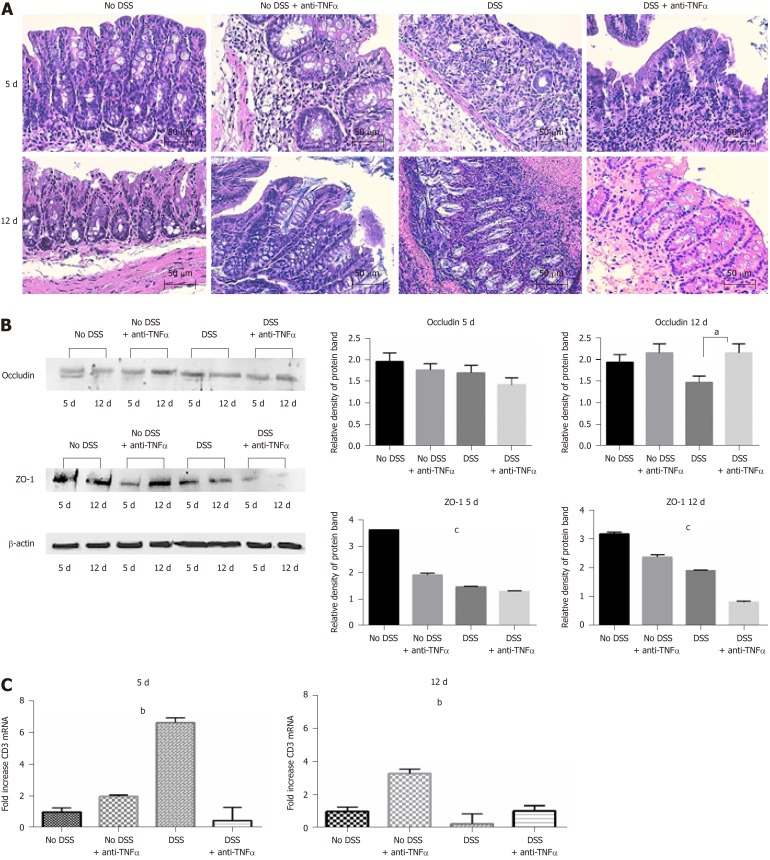
Figure 3.
Histological analysis confirms the strength of the dextran sulfate sodium model. A: Hematoxylin and eosin staining of colon sections of mice from 4 groups of treatment at day 5 and 12. Forty-fold magnification was used. B: Protein expression of tight junctions occludin and ZO-1 in colon tissue. Antibody anti-β-actin was used as endogenous control. On the right, the histograms represent the mean of densitometry values from 3 different experiments. C: CD3 infiltration in colon mucosa was assessed by quantitative PCR of CD3 mRNA. One-way ANOVA (and non-parametric) was calculated; aP < 0.05; bP < 0.01; cP < 0.0001. DSS: Dextran sulfate sodium; TNFα: Tumor necrosis factor α.

