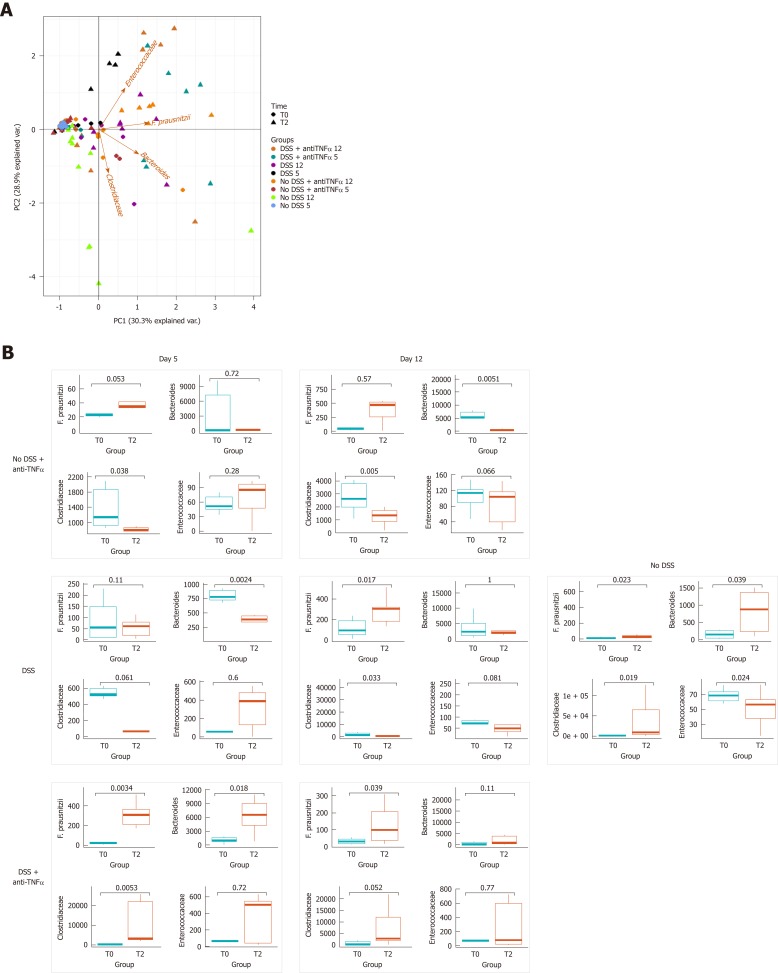
Figure 5.
Bacterial genera and species characterization in presence of an anti- tumor necrosis factor α agent. A: Principal component analysis was represented by a biplot, where the variability among samples and bacterial weight in the variability were expressed. B: Dot plot represents the distribution of bacteria at the beginning of the experiment and at the moment of sacrifice; in the case of “No DSS” mice, the samples from day 5 and 12 are collected together, since no significant changes occurred between day 5 and 12. In left panel, the results were distinguished based on the day of the end of experiment. DSS: Dextran sulfate sodium; TNFα: Tumor necrosis factor α.

