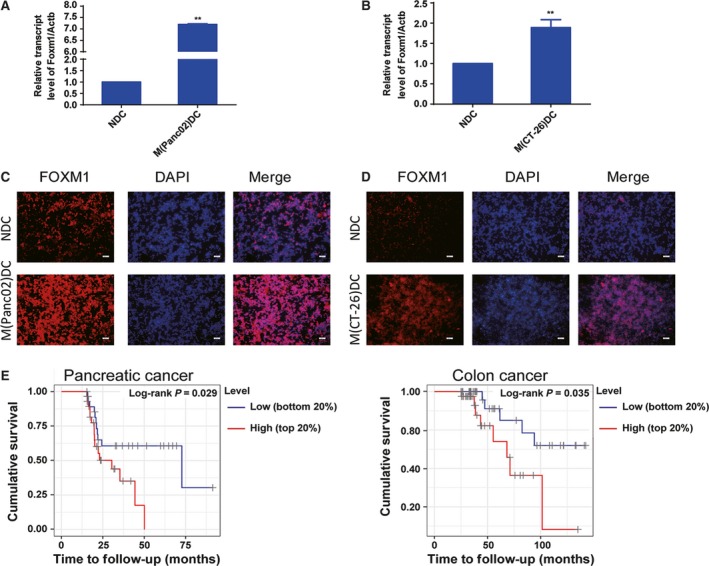
Figure 1.

Forkhead box transcription factor M1 is overexpressed in DCs from tumor. Panc02 and CT‐26 cells were cultured and implanted (2 × 10⁵/50 μL) into the flank of C57BL/6 or BABL/c mice. Mice were euthanized 14 days after injection, and BMDCs generated by the procedure mentioned in Materials and methods. (A and B) The Foxm1 mRNA expression of BMDCs from TBM determined by qRT‐PCR. NDC: DCs from wild‐type mice; M(Panc02)DC: DCs from Panc02 cell implanted mice; M(CT‐26)DC: DCs from CT‐26 cell implanted mice. (C and D) FOXM1 (red) level in BMDCs was determined by immunofluorescent staining. Scale bars, 50 μm. (E) Kaplan–Meier curves of pancreatic cancer and colon cancer stratified by infiltration DCs abundance from the TIMER, a web server for comprehensive analysis of tumor‐infiltrating immune cells. The ‘top 20%’ and ‘bottom 20%’ represented setting the upper or lower 20 percentiles of patient to compare. Statistical significance was calculated using multivariate Cox regression. Data represented mean ± SD from at least 3 independent experiments. **P < 0.01 compared with control.
