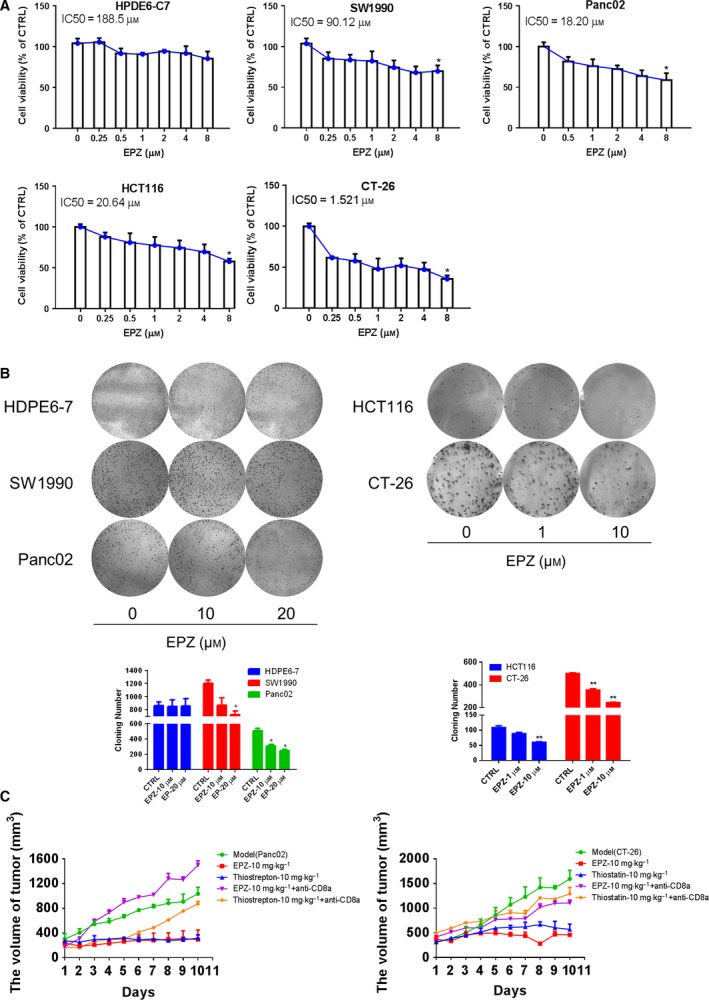
Figure 4.

Effects of EPZ on the PDAC and colon cancer growth. (A) HPDE6‐C7, SW1990, Panc02, HCT116, and CT‐26 cells were cultured and treated with increased concentrations of EPZ from 0 μm to 8 μm for 72 h; the relative IC50 values were calculated by SPSS, shown statistical difference between 0 μm EPZ and 8 μm EPZ (P < 0.05). (B) Pancreatic cancer cells and colon cancer cells were treated and sustained with EPZ [PDAC cell lines (0‐20 μm), colon cell lines (0–10 μm)] for 2 weeks before stained with 0.005% crystal violet. Adjacent picture depicts the crystal violet‐stained colonies and bar graph indicated the cloning efficiency compared with untreated control. (C) Panc02 and CT‐26 cells were cultured and implanted (2 × 10⁵/50 μL) into the flank of C57BL/6J or BABL/c mice. Panc02 cells were implanted on C57BL/6 mice, while CT‐26 cells were implanted on BALB/C mice. In pancreatic cancer and colon cancer subcutaneous xenograft models, the effects of EPZ (10 mg·kg−1) and Thiostrepton (10 mg·kg−1) in vivo were evaluated by intravenous injection and measured the volume of tumor. Mice were sacrificed after 10 days of treatment. Data were presented as means ± SD from at least 10 mice for each experiment. *P < 0.05, **P < 0.01 compared with control.
