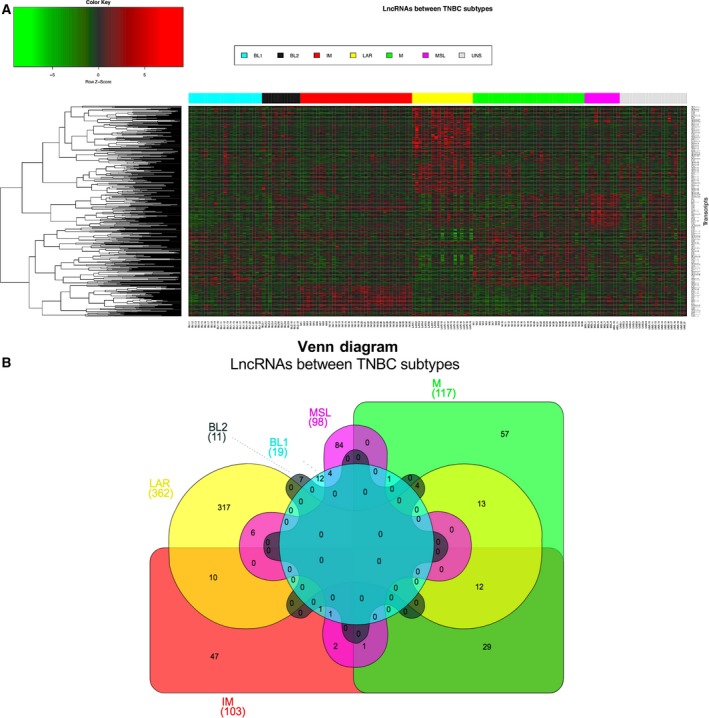
Figure 1.

Differential expression of lncRNA across TNBC subtypes. (A) Supervised hierarchical clustering of the differentially expressed lncRNA in TNBC subtypes. Red represents up‐regulation and green down‐regulation. Rows correspond to transcripts and columns to samples, color bar represents each TNBC subtype. (B) Venn diagram shows the common and differential lncRNA between TNBC subtypes.
