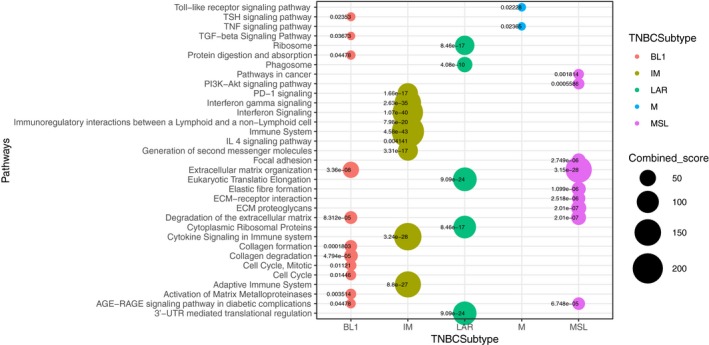
Figure 2.

Overview of the biological pathways by guilt‐by‐association analysis across TNBC subtypes by lncRNA‐mRNA co‐expression. Guilt‐by‐association analysis showing the significant enriched pathways of the resulted co‐expression mRNA‐lncRNA. Pathway enrichment analysis resulted in significant association with cancer‐related signaling. The y‐axis label represents pathways and the x‐axis label represents TNBC subtypes. Bubble chart shows biological pathways enrichment by differential expression of lncRNA for each TNBC subtype. Size and color of the bubble represent the score each pathway and TNBC subtypes, respectively.
