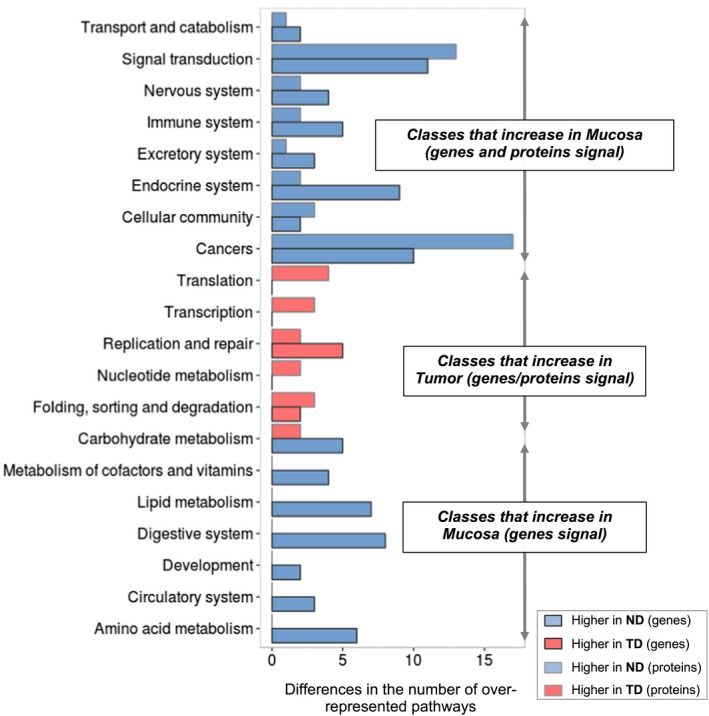
Figure 4.

Global trends in processes overrepresented in diabetic samples at the transcriptional and translational levels. Differences in the number of KEGG pathways overrepresented in diabetic samples, classified in superclasses from two analyses (transcriptome and proteome). In light blue, the number of processes overrepresented in diabetic colonic mucosa (compared to nondiabetic colonic mucosa), and in light red, the number of processes overrepresented in diabetic tumor (compared to nondiabetic tumor). Dark borders represent the changes at translational level and light gray borders the changes at translational level.
