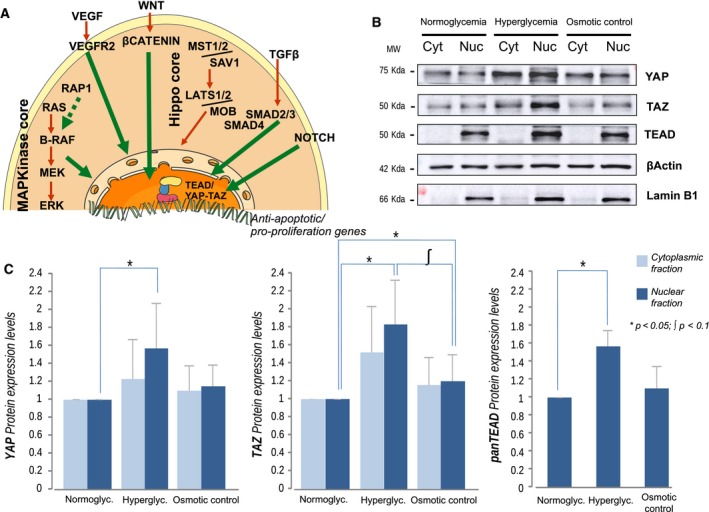
Figure 6.

The TEAD/YAP‐TAZ axis is upregulated under hyperglycemia. (A) Molecular model where pathways found overrepresented in diabetic normal colonic mucosa but not in diabetic tumors converge in the TEAD/YAP‐TAZ axis. (B) Immunoblotting analysis of nontumor colon cultured cells. Three different culture conditions were assessed, representing normoglycemia, hyperglycemia, and osmotic control, for cytoplasm and nuclear samples. (C) Quantification of cell culture immunoblotting results. TEAD was only found in the nucleus. No differences were found among cytoplasmic fractions. Significance was calculated using the Mann–Whitney U‐test and 3 biologically independent replicates. Significance levels are represented by *(P‐value <0.05) and ʃ (P‐value <0.1). Error bars represent standard deviation.
