Figure 1.

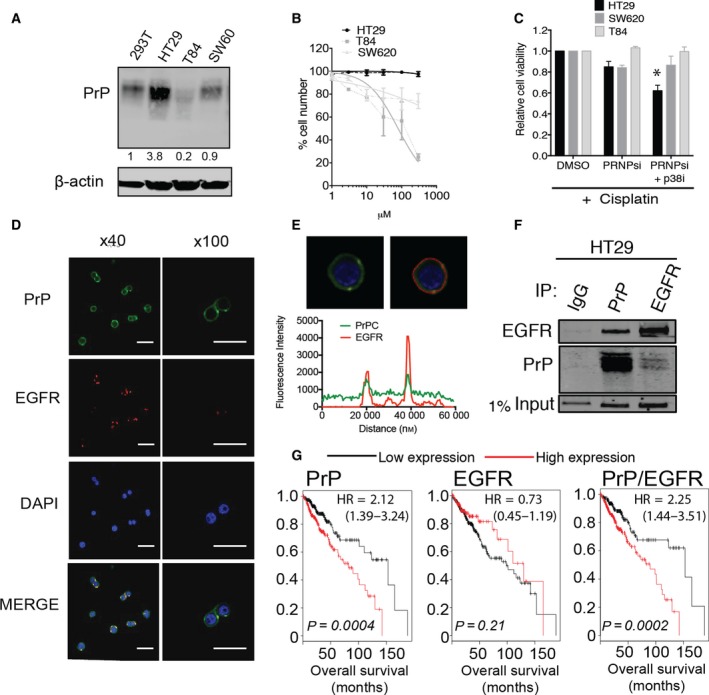
Prion protein associates with EGFR. (A) Western blot analysis of PrPC expression in HT29, SW620, T84, and ‘normal‐like’ 293T cell lines. β‐Actin serves as a loading control. (B) Cisplatin dose–response curves of HT29, SW620, and T84 cell lines. Solid lines indicate normalized nonlinear fit and error bars ± SEM. (C) HT29, SW620, and T84 response to cisplatin treatment with or without PrPC knockdown and p38 MAPK inhibitor. Cell viability was determined by MTS (% viability relative to DMSO control ± SEM and significance measured by two‐tailed Student's t‐test *P < 0.05). (D) Subcellular localization of PrPC (green), EGFR (red), and nuclei‐stained DAPI (blue), scale bar 100 μm. (E) Fluorescence signal intensity of PrPC and EGFR in HT29 cells, indicating colocalization. (F) Immunoprecipitation of PrP and EGFR by reciprocal antibodies. HSP70 probed for 1% of lysate input. (G) RNA‐seq analysis of 452 colon patient samples for correlation between PrPC and EGFR expression levels and patient outcome (significance determined by logrank test). All data are the means of three independent biological replicates and error bars ± SEM. PRNPsi, PrPC knockdown; p38i, p38 MAPK inhibitor.
