Figure 2.

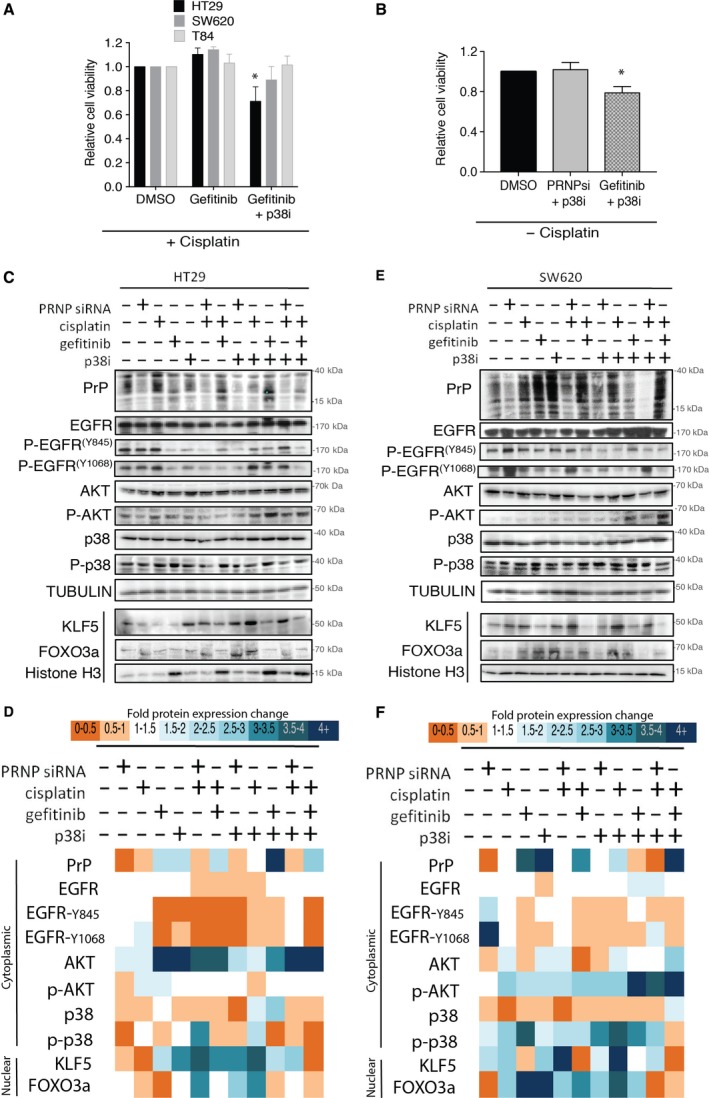
Analysis of signaling downstream of PrPC/EGFR by protein expression. (A) HT29, SW620, and T84 cell line viability in response to cisplatin treatment with or without gefitinib and p38 MAPK inhibitor. Cell viability determined by MTS (% viability relative to DMSO ± SEM and significance measured by two‐tailed Student's t‐test *P < 0.05) (B) Cell viability of HT29 cells in response to p38 MAPK inhibitor with or without PrPC knockdown and gefitinib in the absence of cisplatin. Cell viability determined by MTS (% relative to DMSO ± SEM and significance measured by two‐tailed Student's t‐test *P < 0.05). (C) Protein expression analysis of the nuclear and cytosol fractions from HT29 cells from each treatment group. Histone H3 and α‐tubulin are used as loading controls for nuclear and cytosolic fractions, respectively. (D) Average densitometry of three independent isolates standardized to the controls and finally expressed as relative change to untreated cells. (E) Protein expression analysis of the nuclear and cytosol fractions from SW620 cells from each treatment group. Histone H3 and α‐tubulin are used as loading controls for nuclear and cytosolic fractions, respectively. (F) Average densitometry of two independent isolates standardized to the controls and finally expressed as relative change to untreated cells.
