
Figure 2. Inflammatory markers.
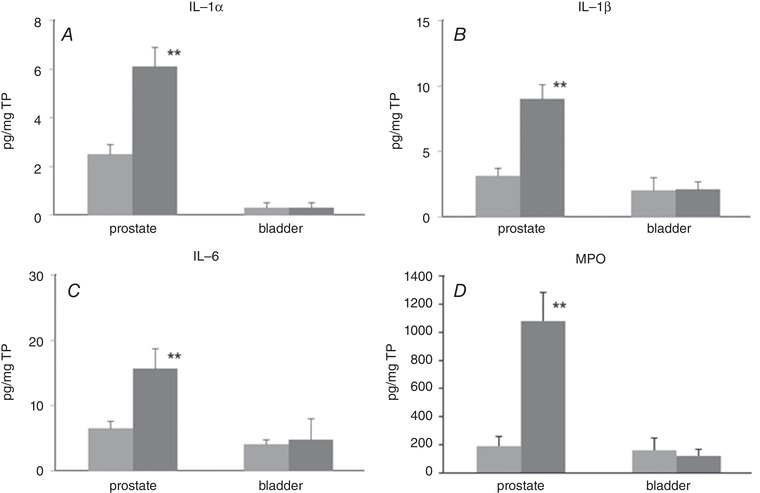
Proinflammatory cytokine levels (A, IL‐1α; B, IL‐1β; C, IL‐6) and MPO activity were measured in the prostate and bladder using ELISA. Light grey columns, vehicle‐treated rats. Dark grey columns, formalin‐treated rats. n = 6 in each group. Columns with bars represent mean ± SEM. ** P < 0.01 between groups. TP, total protein.