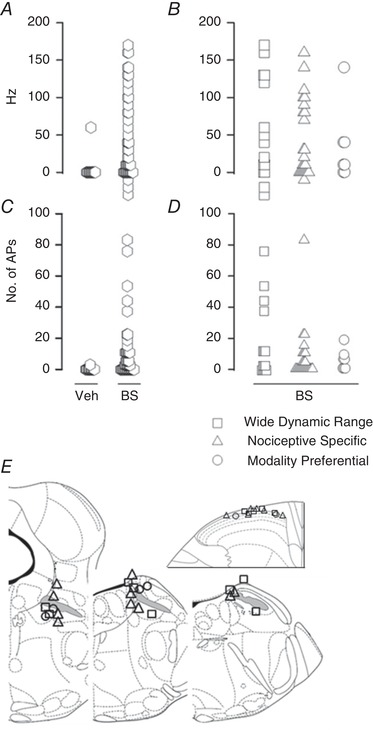
Figure 7. Quantification of the effect of bicuculline and strychnine (BS) application on neuronal responses to brush.

The peak firing frequency and the mean number of APs in response to 10 successive brushes were quantified before and after the application of vehicle or BS on the spinal cord. A and C show the distribution plot of the differences of the peak firing frequency (A) and number of APs (C) of the responses to brush obtained for all neurons tested, before and after spinal cord application of vehicle (n = 13) and BS (n = 47). B (peak firing frequency) and D (number of APs) focus on the responses of neurons before and after spinal cord application of BS (n = 47). B and D are a detailed view of the ‘BS column’ in A and C, the neurons being separated into 3 different groups: wide dynamic range (n = 15), nociceptive specific (n = 25), and polymodal with one preferential modality (n = 7: 6 cold preferential, 1 mechanical preferential). Overall, the greatest increase in number of APs after BS application was observed for wide dynamic range neurons. E, the location of the stimulation and recording sites for the neurons showing an increase of more than 2 APs/brush after BS application did not differ from neurons that responded less to BS application. The superior cerebellar peduncle or brachium conjonctivum is highlighted in grey.
