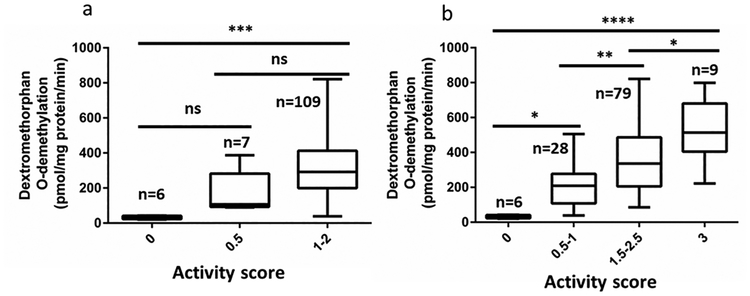
Figure 2.
Relationship between CYP2D6 enzyme activity in human liver microsomes and activity score derived from genotype data using CPIC standard score system (a) or new score system (b). Data are present as box plot. The box and horizontal lines show the 25th and 75th percentiles and mean, and whiskers show the minimum and maximum values. The differences between groups were analyzed by ANOVA.

