
Fig. 1.
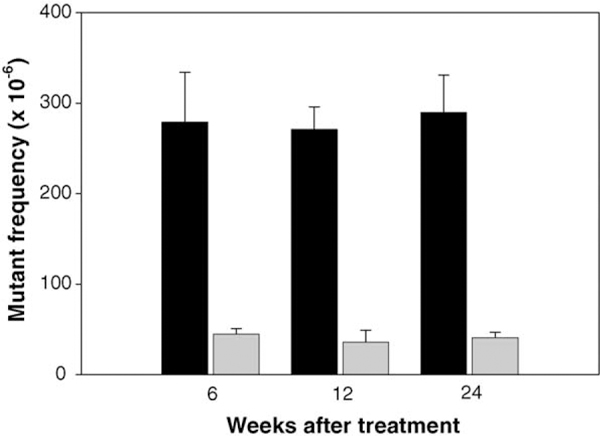
Mutant frequencies in the liver cII gene at different times after dosing male Big Blue mice with ENU transplacentally. The dark bars represent the MFs for the mice treated with ENU and the light bars are the data from the concurrent controls. ENU increased MFs at all of the time points over the controls (p <0.001), whereas no significant difference was found among the treatment groups (p ≥ 0.79).