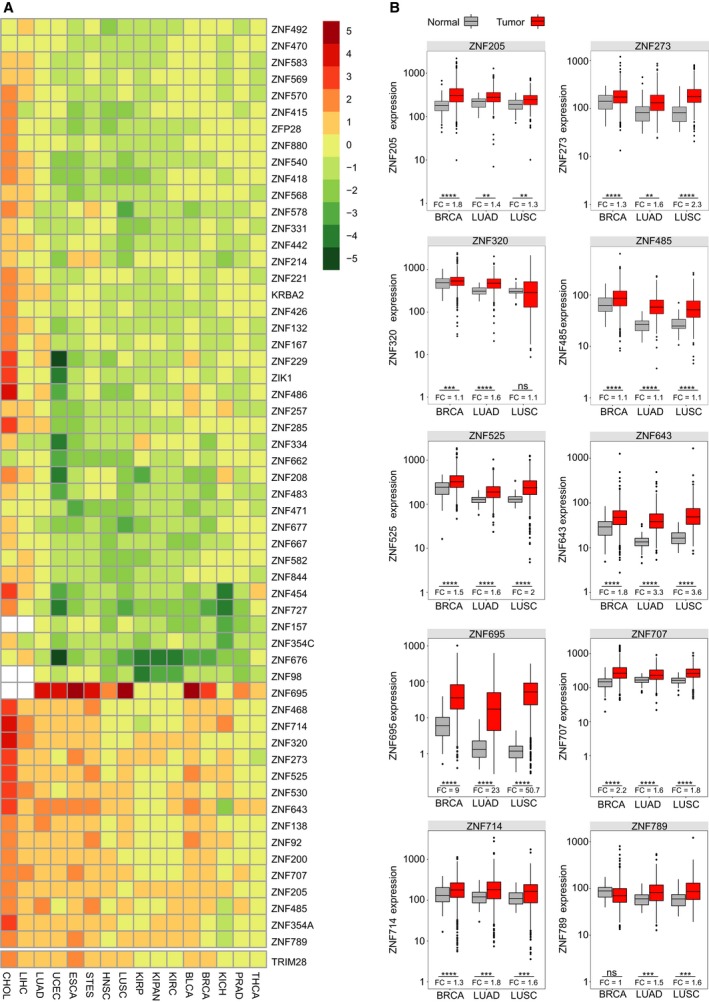
Figure 1.

The expression level of selected KRAB‐ZNFs in TCGA samples. (A) Heatmap and supervised clustering of KRAB‐ZNFs with changed expression in 16 tumor cohorts compared to normal tissues. RSEM data were normalized with DESeq. Results were generated based on the binomial test with a cutoff threshold of a median of absolute log2 fold change > 1/2. (B) Boxplots representing selected cancer‐associated KRAB‐ZNF expression in normal and tumor tissue samples of breast and lung cancers. BRCA (N: 112, T: 1093), LUAD (N: 59, T: 515), LUSC (N: 51, T: 501). *P < 0.05, **P < 0.01, ***P < 0.001, ****P < 0.0001 as assessed by t‐test with Tukey HSD correction.
