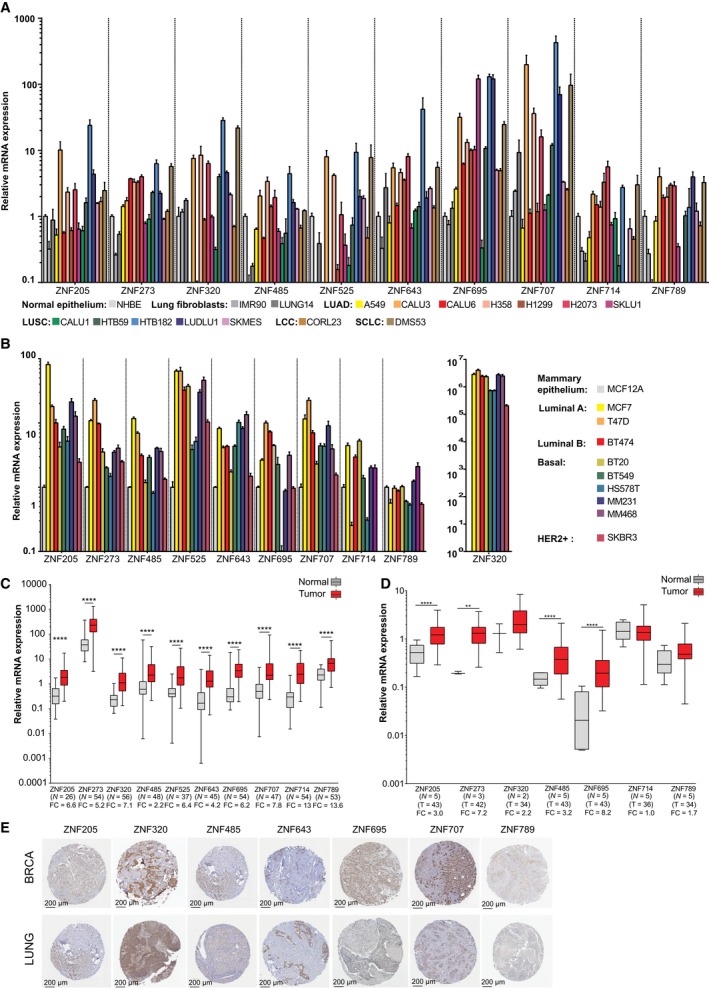
Figure 2.

The expression level of selected KRAB‐ZNFs in independent sets of breast and lung cell lines and tissues. (A) RT‐qPCR expression of selected KRAB‐ZNFs in lung cancer cell lines compared to normal human bronchial epithelium. (B) RT‐qPCR expression of selected KRAB‐ZNFs in breast cancer compared to normal mammary epithelium. (A,B) Bars indicate mean expression for three technical replicates ± SD. (C) RT‐qPCR expression of selected KRAB‐ZNFs in lung cancer tissue samples compared to paired normal tissue. P‐values were calculated by Wilcoxon test. (D) RT‐qPCR expression of selected KRAB‐ZNFs in breast cancer tissue compared to normal tissue samples. P‐values were calculated using the Mann–Whitney U‐test. (E) Immunohistochemistry staining for selected KRAB‐ZNFs in lung and breast tissue microarray cancer samples from The Human Protein Atlas. (C,D) *P < 0.05, **P < 0.01, ***P < 0.001, ****P < 0.0001. Number of samples in each group and FC values are provided below the graphs.
