Figure 3.

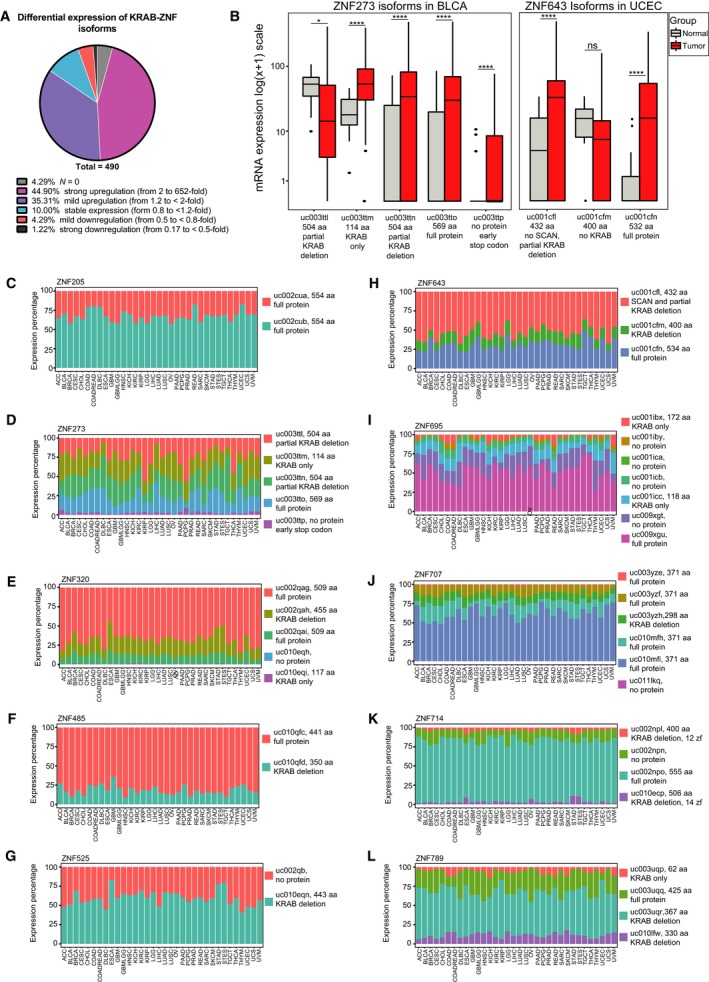
Expression of KRAB‐ZNF splicing isoform in TCGA datasets. (A) Pie chart depicting the percentage of isoforms that appeared statistically significant (n = 490) in our differential expression analysis comparing normal and tumor tissues. The isoforms fell into six categories: with null expression in normal samples, strongly and mildly upregulated in tumor samples, with stable expression, mildly and strongly downregulated in tumor samples. (B) The expression of only two pairs of isoforms is switched between normal and tumor samples. The boxplots represent the isoforms of ZNF273 in BLCA (N: 19, T: 408) and ZNF643 in UCEC (N: 11, T: 370). Statistical significance was calculated based on t‐test with FDR correction: *P < 0.05, ****P < 0.0001. (C–L) Plots demonstrate percentages of total expression of each of the listed splicing variants of 10 selected cancer‐associated KRAB‐ZNFs across 34 TCGA cohorts.
