Figure 8.

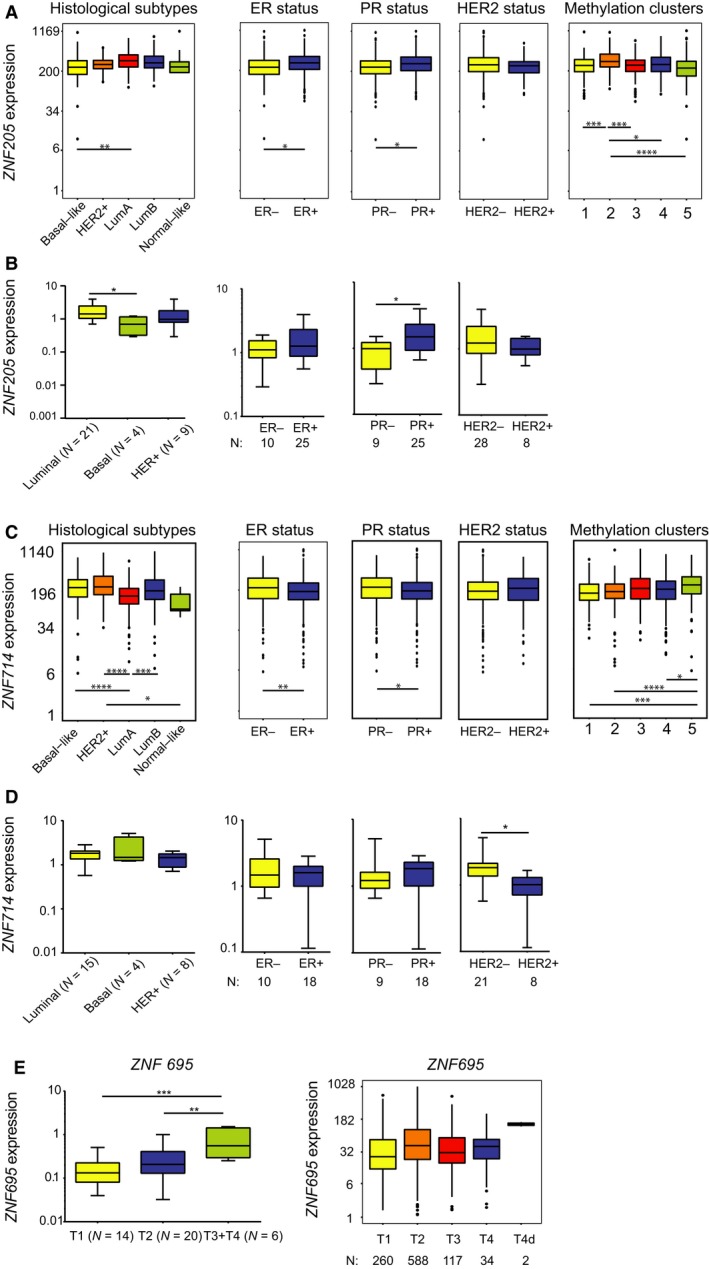
ZNF205 and ZNF714 correlate with various clinical and molecular parameters in BRCA samples. (A) ZNF205 expression positively correlates with luminal A subtype, ER+, and PR+ tumors, while its expression is the highest in methylation cluster 2 in TCGA datasets. (B) ZNF205 expression positively correlates with luminal A subtype and PR+ tumors in an independent set of breast cancer tissues. (C) ZNF714 expression positively correlates with HER2+, ER−, and PR− tumors, while its expression is the highest in methylation cluster 5 in TCGA datasets. (D) ZNF714 expression positively correlates with HER2− tumors in an independent set of breast cancer tissues. (E) ZNF695 expression positively correlates with advanced tumor stage in an independent set of breast cancer tissues, but not in the TCGA dataset. (A, C) Basal‐like (n = 98), HER2‐enriched (n = 58), luminal A (n = 233), luminal B (n = 129), normal‐like (n = 8), ER+ (n = 603), ER− (n = 179), PR+ (n = 526), PR− (n = 253), HER2+ (n = 115), HER2− (n = 654), methylation cluster 1: (n = 137), 2: (n = 174), 3: (n = 101), 4: (n = 246), 5: (n = 295). (B, D, E) Number of samples provided in the figure. (A–E) *P < 0.05, **P < 0.01, ***P < 0.001, ****P < 0.0001 as assessed by t‐test with Tukey HSD correction (A, C, E) or unpaired t‐test (B, D).
