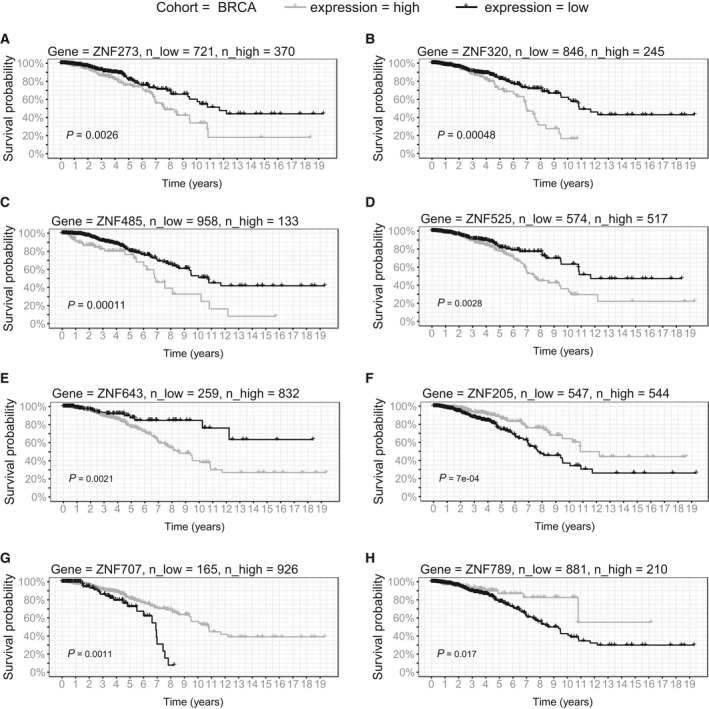
Figure 9.

Survival analysis in TCGA BRCA patients. Kaplan–Meier curves represent ZNF273 (A), ZNF320 (B), ZNF485 (C), ZNF525 (D), ZNF643 (E), ZNF205 (F), ZNF707 (G), and ZNF789 (H) association with patient survival in LUSD. KRAB‐ZNFs expression was transformed into binary high/low groups based on maximally ranked statistics. P‐values assessed by log‐rank test and number of patients in each group is provided in the figure.
