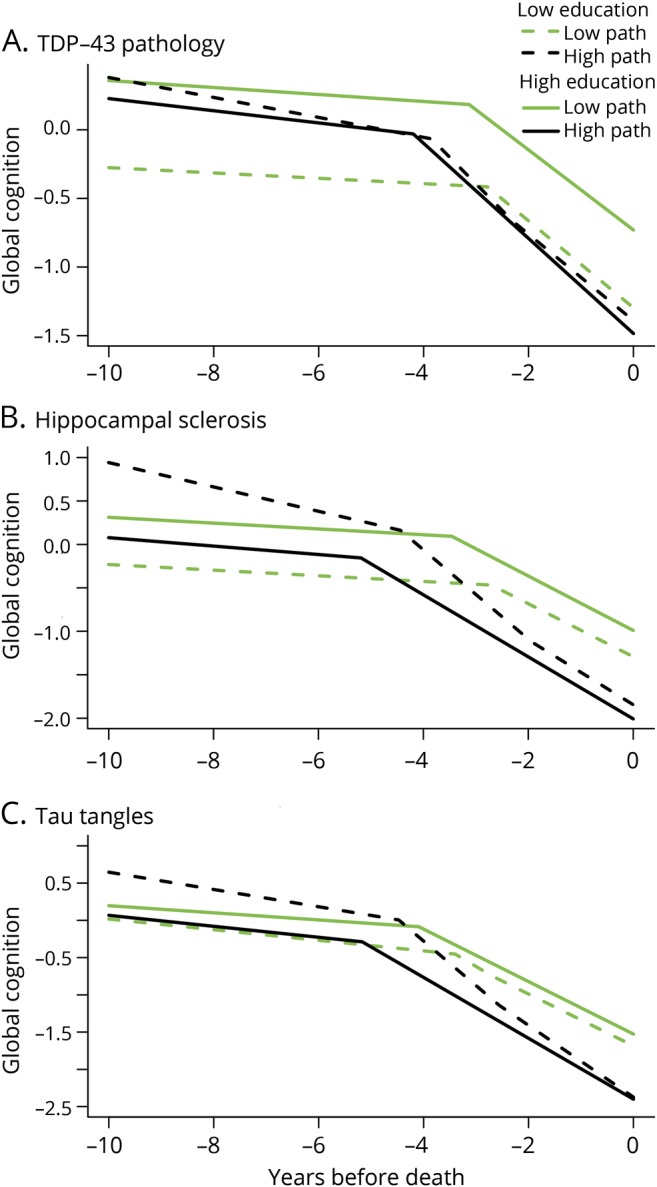
Figure 2. Relation of education and neurodegeneration to trajectories of global cognitive change.

Predicted paths of global cognitive change in typical participants who died with high (75th percentile, 18 years, solid lines) vs low (25th percentile, 14 years, dashed lines) levels of education and high (black color) vs low (green color) postmortem levels of TDP-43 pathology (A), hippocampal sclerosis (B), and tau tangles (C), from mixed-effects change point models adjusted for age at death and sex. path = pathology; TDP-43 = TAR DNA-binding protein 43.
