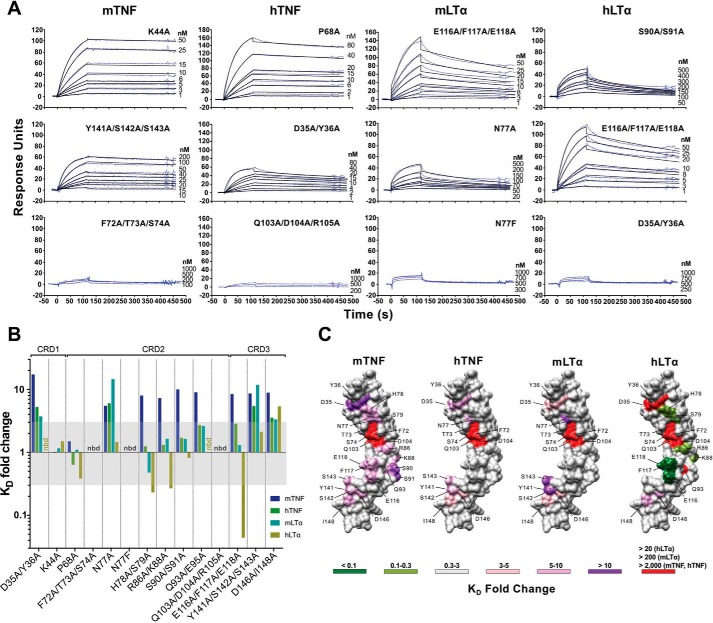
Figure 4.
Effect of the CrmD mutants on ligand-binding affinity. The binding affinity of the CrmD mutants for mTNF, hTNF, mLTα, and hLTα was calculated by SPR. A, examples of the binding sensorgrams and fittings obtained for the determination of the binding kinetic constants shown in Table 1. The corresponding analyte and CrmD mutant are indicated above each graph column and at the top right corner of each graph, respectively. The top graph row includes sensorgrams for CrmD mutants whose binding affinity for the indicated cytokine was comparable with that of WT CrmD. The middle row contains sensorgrams for mutants with significantly reduced (Y141A/S142A/S143A:mTNF, D35A/Y36A:hTNF, and N77A:mLTα) or enhanced (E116A/F117A/E118A:hLTα) binding affinity, and the bottom row shows examples where no binding was detected (nbd) or it was too weak to be analyzed accurately. B, -fold change (KD(mutant)/KD(WT)) caused by each CrmD mutant on the KD of CrmD WT for mTNF, hTNF, mLTα, and hLTα. The KD -fold change range that was considered nonsignificant (0.3–3) is shaded in gray. nbd, no binding detected. In C, residues whose alanine mutation resulted in a significant increase (>3-fold change) or decrease (<0.3-fold change) in the KD of CrmD WT for each ligand are located, colored, and labeled on a model of the CrmD surface (gray) generated by I-TASSER (62). The corresponding ligands are shown above the CrmD models. The legend indicates the colors assigned to the different KD -fold change ranges. The maximum detectable KD -fold increase (red) varied among the different analytes (>20 for hLTα, >200 for mLTα, and >2,000 for mTNF and hTNF).

