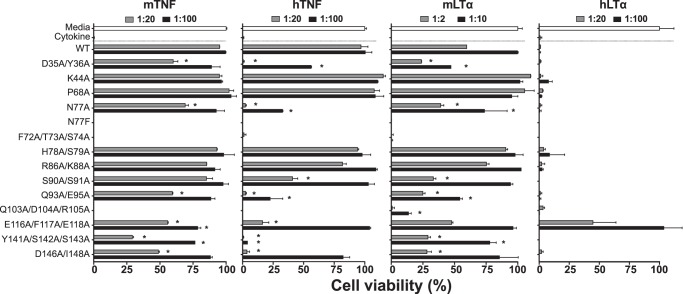
Figure 5.
Inhibitory properties of CrmD mutants. A cytotoxic dose of mTNF, hTNF, mLTα, and hLTα was incubated with L929 cells in the absence (Cytokine) or presence of CrmD WT or the indicated mutants at increasing cytokine:protein molar ratios (see legends above each graph). After 18 h, cell survival was assessed as the A490 determined using a Cell Titer Aqueous One Solution kit. Data are represented as the percentage relative to the A490 recorded for cells incubated without cytokine (Media; 100% cell viability). The corresponding effector cytokine is indicated above each graph. Results are shown as mean ± S.D. (error bars) of triplicates of three representative experiments. Asterisks indicate mutants that displayed significantly different viability values compared with CrmD WT at the same protein dose (*, p < 0.05, analysis of variance with Bonferroni multiple comparison test).

