Figure 6.

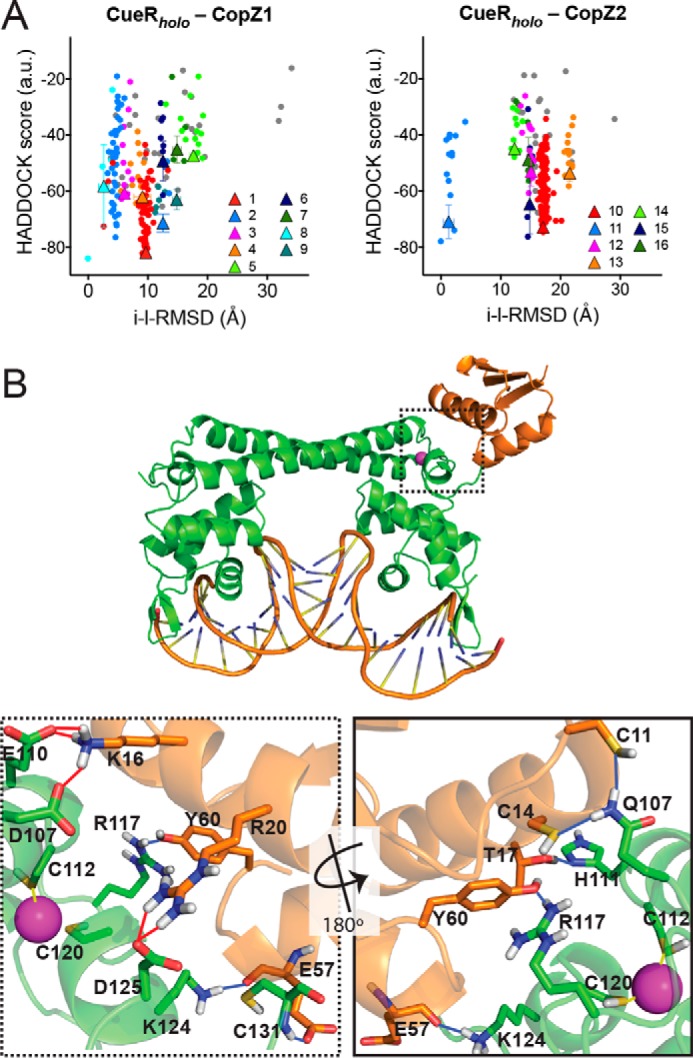
In silico CopZs interaction with CueR. A, intermolecular docking scores as a function of the interface-ligand r.m.s. deviations for residues in the intermolecular contact area (10 Å cutoff). Individual clusters numbered as shown in Table S2 are indicated in various colors. Conformations that did not fit in any cluster are shown as gray dots. The clusters averages are indicated as triangles with error bars. B, CueRholo-CopZ1apo interaction model. The conformer with lower HADDOCK score from cluster 1 is shown. CueR (green), CopZ1 (orange), DNA, Cu+ (cyan), binding residues (sticks), H-bonds (blue lines), and salt bridges (red lines) are represented. Dotted frame shows a detail of the interaction site and the continues frame a 180° rotated view (bottom panels).
