Figure 7.

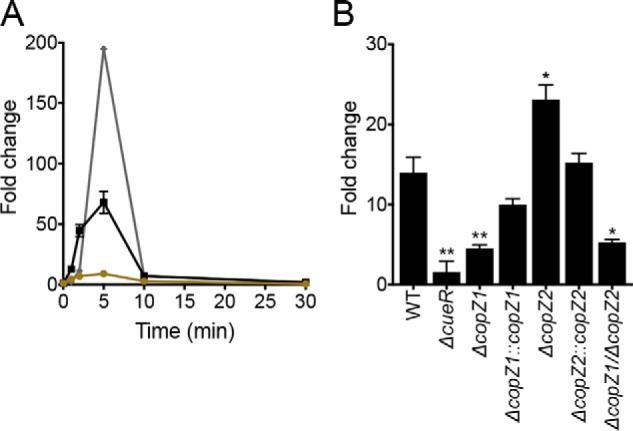
Transcriptional levels of copZ1, copZ2, and copA1 upon Cu2+ stress. A, kinetics of expression at RNA level of copZ1 (ochre circles), copZ2 (black squares), and copA1 (gray diamonds) upon 0.5 mm CuSO4 treatment. B, copA1 expression in ΔcueR, ΔcopZ1, ΔcopZ2, ΔcopZ1/ΔcopZ2 mutants and complemented strains after 2 min of 0.5 mm CuSO4 treatment. Data are the mean ± S.E. of three independent experiments. Significant differences from the WT as determined by unpaired two-tailed Student's t test are: *, p < 0.05; **, p < 0.01.
