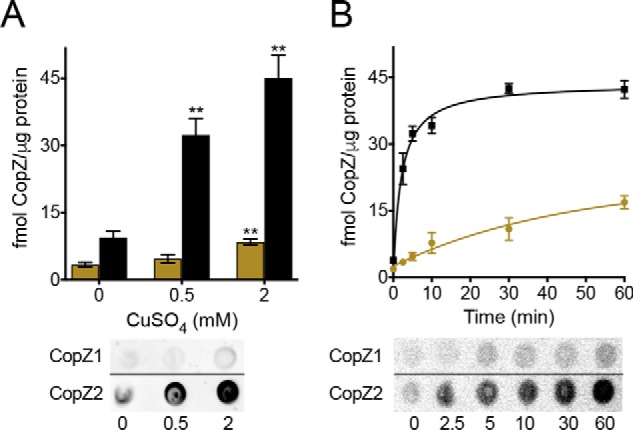
Figure 8.

In vivo abundance of CopZ1 (ochre) and CopZ2 (black) proteins. ΔcopZ1 and ΔcopZ2 were complemented with the corresponding His-tagged gene under control of the native promoter. His-tagged proteins were immunostained and their abundance calculated using a standard curve of pure His-tagged protein. The horizontal dividing lines indicate where the images have been spliced; signals were from an identical original image and have not been altered. CopZs levels were determined after exposure to (A) different CuSO4 concentrations during 10 min or (B) 0.5 mm CuSO4 during different times. Data are the mean ± S.E. of three independent experiments. Significant differences from values in the absence of CuSO4 as determined by unpaired two-tailed Student's t test were: **, p < 0.01.
