Figure 3.
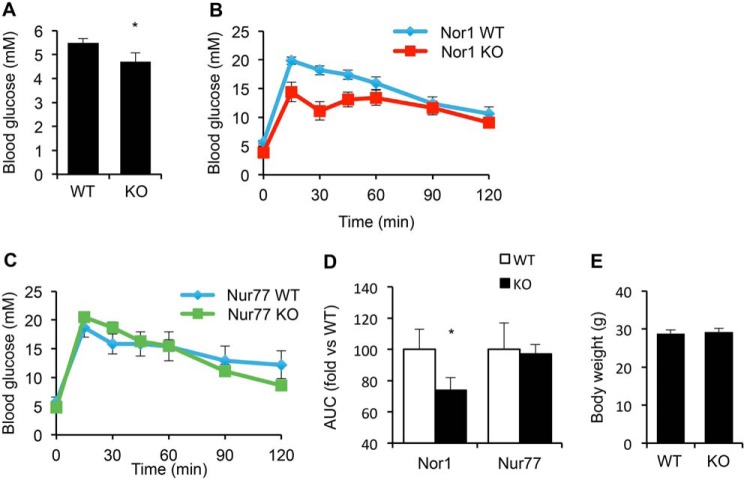
Invalidation of Nor1 improves glucose tolerance. A, random-fed blood glucose in WT versus Nor1 knockout mice. B and C, glucose tolerance test in Nor1 (B) and Nur77 knockout mice. C, area under the curve for each genotype. D, body weight of 6-month-old WT and Nor1 knockout mice. E, body weight of WT and Nor1 knockout mice. All results are represented as means ± S.E.; n = 10 mice in each group. *, p < 0.05 versus WT animals; AUC, area under the curve.

