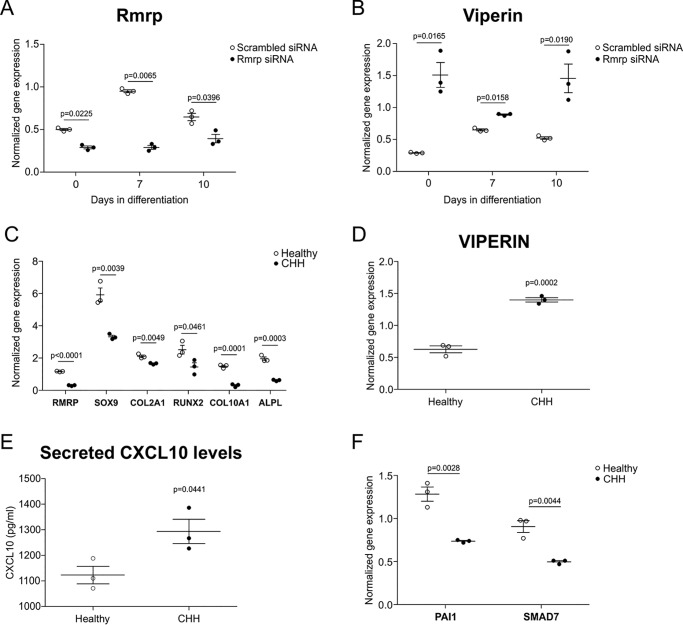
Figure 8.
The viperin–CXCL10–TGF-β/SMAD2/3 axis is deregulated in chondrocytic CHH cells. Rmrp RNA expression was reduced in ATDC5 cells by transfection of a specific siRNA duplex on day −1, day 2, and day 5 during chondrogenic differentiation. A scrambled siRNA was used as control. Samples were harvested for RT-qPCR analysis at day 0, 7, or 10 in differentiation. Expression of Rmrp (A) and viperin (B) was determined at indicated time points. The data were normalized to β-actin mRNA levels, and individual normalized values are presented in dot plots. The data were acquired from three biological replicates. An independent samples t test was performed relative to scrambled control using GraphPad Prism 5. The p values are indicated, and error bars represent means ± S.E. Human dermal fibroblasts from three CHH patients (RMRP alleles of CHH patients carried following mutations: 127G → A and 261 C → G; 4 C → T and 77C → T; 70 A → G and 70A → G), and three healthy controls were transdifferentiated into the chondrogenic lineage by hyperconfluent plating in wells coated with Aggrecan (21, 48). RNA was isolated at day 3 of transdifferentiation, and gene expression of RMRP, SOX9, COL2A1, RUNX2, COL10A1, and ALPL mRNAs was determined (C). Gene expression of VIPERIN (D) and of PAI1 and SMAD7 (F) was determined in samples from C. Supernatants were collected from these cultures, and secreted CXCL10 protein was determined with ELISA (E). Gene expression data from transdifferentiated fibroblasts was normalized to CYCLOPHILIN mRNA levels, and individual normalized values are presented in dot plots. Secreted CXCL10 data are absolute concentrations (pg/ml) and presented in dot plots. For statistical evaluation, independent sample t tests were performed relative to healthy controls using GraphPad Prism 5. The p values are indicated. Error bars represent the means ± S.E. Graphs are representative examples of three independent experiments.

