Figure 1.
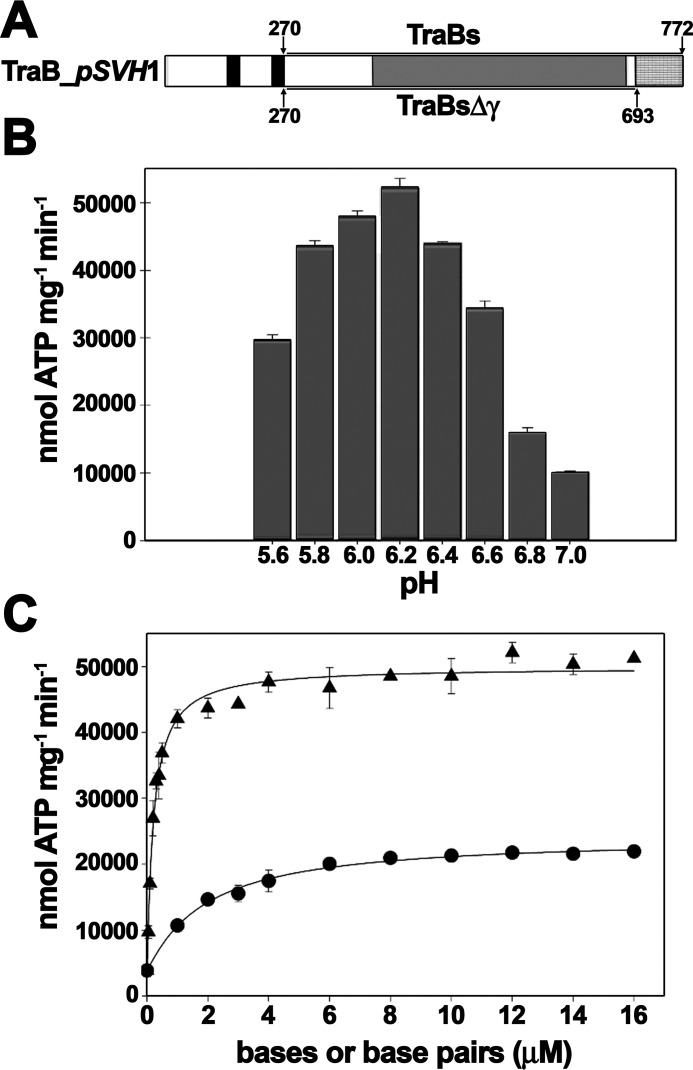
Analysis of TraBs ATPase activity. A, schematic representation of Streptomyces TraB of plasmid pSVH1. Black bars represent the N-terminal transmembrane helices, as predicted with TMHMM (www.cbs.dtu.dk/services/TMHMM-2.0).4 The motor domain is depicted in gray and the C-terminal γ-domain in gray squares. TraBs consists of a deletion of the first 270 residues that contain the transmembrane helices, whereas TraBsΔγ also contains a deletion of the C-terminal γ-domain. B, pH-dependence of TraBs ATPase activity. ATP turnover was measured using a coupled spectrophotometric assay. Reactions contained TraBs (50 nm), 5 mm ATP, and 45 bp dsDNA (250 nm), buffered at the corresponding pH value. C, effect of ssDNA and dsDNA on TraBs ATPase activity. Reactions were carried out at increasing concentrations of ssDNA or dsDNA substrates, represented as micromolar concentrations of bases (for ssDNA) or bp (for dsDNA). Black triangles, TraBs + dsDNA, formed by the annealing of 45-mer nucleotides A and B; black dots, TraBs + ssDNA (oligonucleotide A). Data were fit to a Hill equation and represent the average of at least three different experiments. Error bars: S.D.

