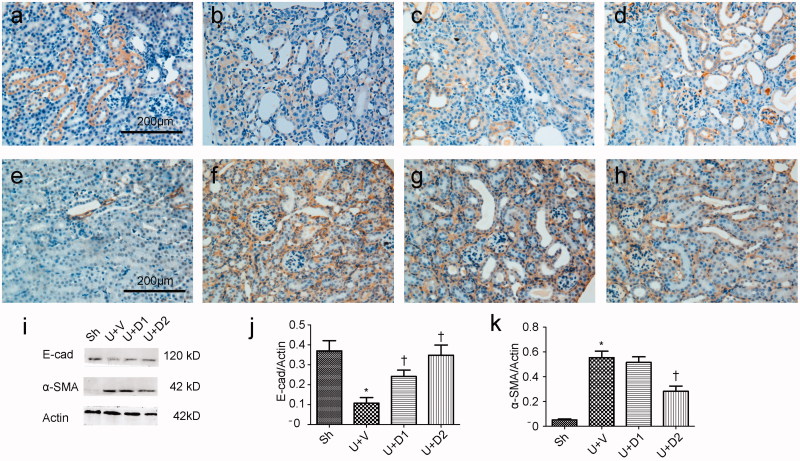
Figure 3.
Representative photographs of E-cadherin (a-d) and α-SMA (e-h) staining. (a, e) Sh; (b, f) U + V; (c, g) U + D1; (d, h) U + D2. (i) Western blot analysis for E-cadherin and α-SMA. (j, k) Semiquantitative analysis for protein expression of E-cadherin and α-SMA. *p < 0.05 VS. Sh, †p < 0.05 VS. U + V. Scale bar = 200 μm.

