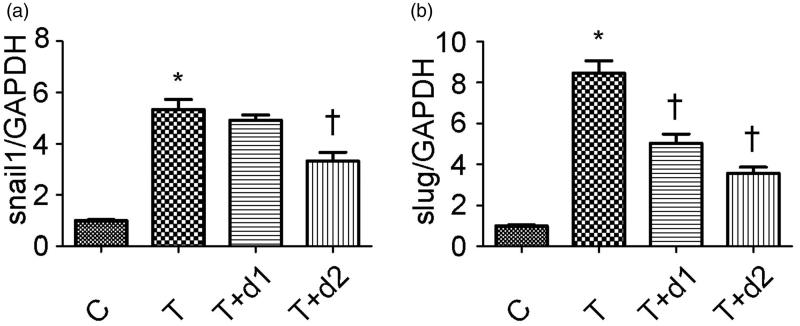
Figure 5.
Semiquantitative analysis for mRNA expression levels of snail1 and slug. C: HK-2 treated with media only; T: HK-2 treated with TGF-β1 (10 ng/mL); T + d1: HK-2 treated with TGF-β1 (10 ng/mL) and UA (10 μM); T + d2: HK-2 treated with TGF-β1 (10 ng/mL) and UA (50 μM). *p < 0.05 VS. C, †p < 0.05 VS. T.

