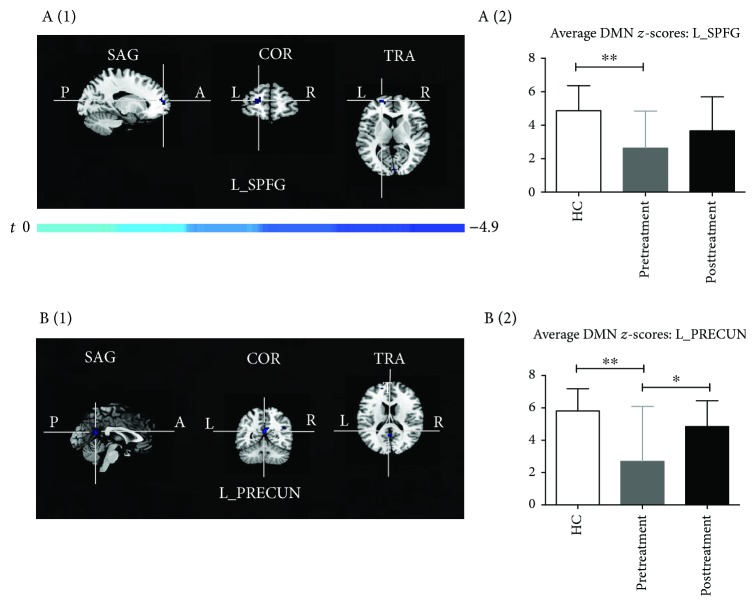
Figure 3.
(a (1), b (1)) T-maps of differences in DMN connectivity between the Pretreatment group and HC group (P < 0.05, AlphaSim corrected). (a (2), b (2)) Bar graphs of the mean DMN z-scores of the group's different regions (L_SPFG and L_PRECUN). DMN: default mode network; CM: chronic migraine; HC: healthy controls; L_SPFG: left superior prefrontal gyrus, MNI coordinates (x, y, and z): -21, 60, and 9, respectively; L_PRECUN: left precuneus, MNI coordinates (x, y, and z): 0, -54, and 18, respectively; ∗P < 0.05 and ∗∗P < 0.01.

