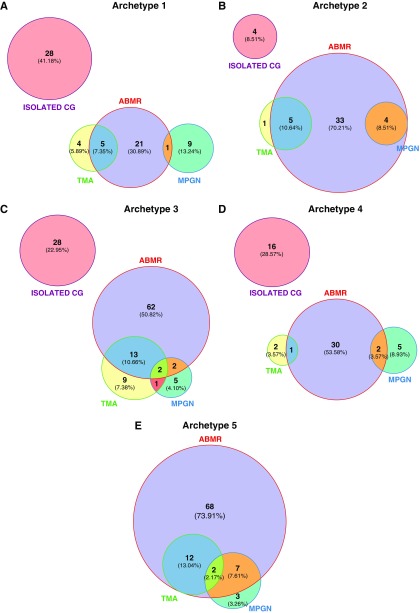
Figure 5.
TG archetypes are associated with distinct overlapping causes. Data are on the basis of the 385 patients with TG. Each circle corresponds to one cause. Circle sizes are correlated to the number of biopsy specimens in each TG-related cause category. (A) Archetype 1. (B) Archetype 2. (C) Archetype 3. (D) Archetype 4. (E) Archetype 5.

