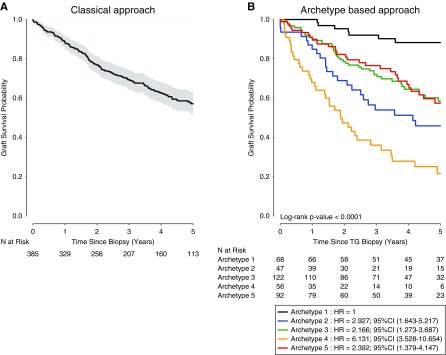
Figure 6.
TG archetypes are associated with distinct outcomes. (A) Allograft survival probability (Kaplan–Meier) since the diagnosis of TG. (B) Probability of allograft survival after the TG biopsy, on the basis of the five archetypes. The overall difference between the five archetypes was significant (P value <0.001).

