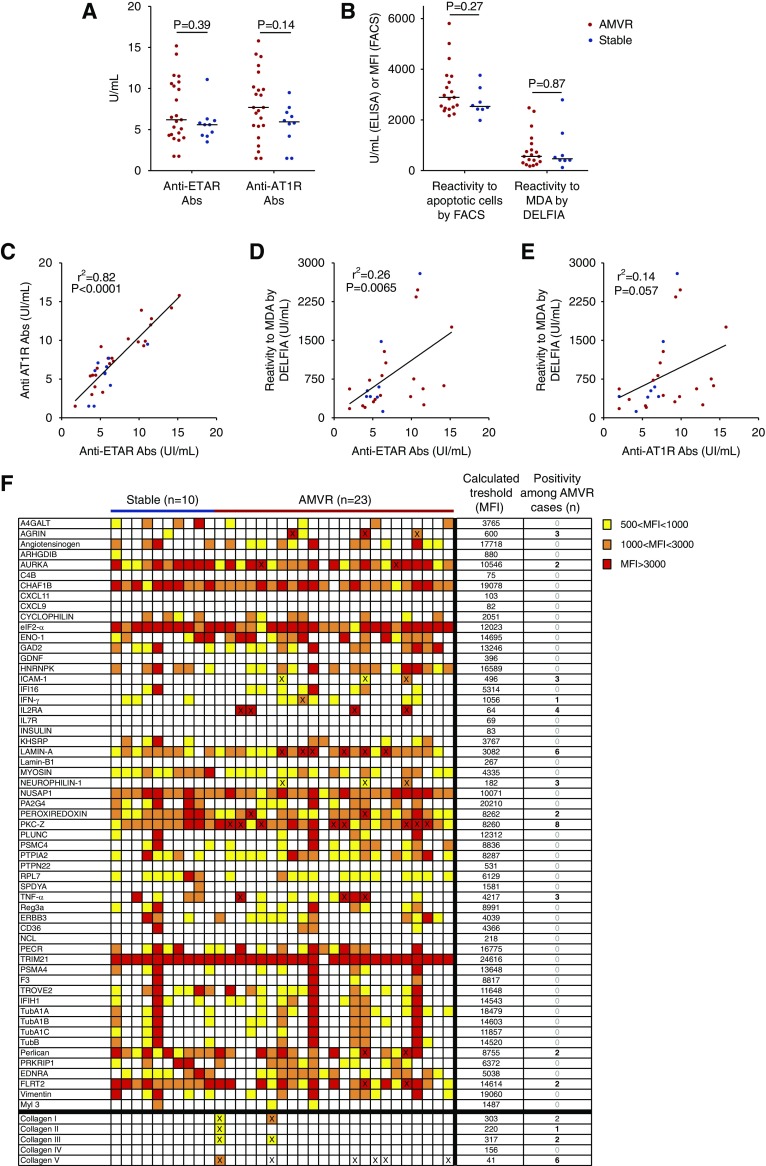
Figure 3.
Assessment of known AECAs. (A) Titers of anti–AT-1R and anti-ETAR antibodies in serum samples collected on the day of transplantation from 23 patients with early AMVR without anti-HLA DSAs and ten nonsensitized KTRs who did not experience any rejection during their first year after transplant and were used as controls. P values were determined using the Mann–Whitney test. (B) Assessments of natural polyreactive antibodies were conducted using flow cytometry to detect reactivity to apoptotic cells or using a dissociation-enhanced lanthanide fluoroimmunoassay (DELFIA) to detect reactivity to malondialdehyde (MDA) in 19 patients with AMVR and eight controls. P values were determined using the Mann–Whitney test. (C) Correlation between anti–AT-1R and anti-ETAR antibody titers at the time of transplantation. (D) Correlation between NAbs reactive to MDA and anti-ETAR antibodies at the time of transplantation. (E) Correlation between NAbs reactive to MDA and anti–AT-1R antibodies at the time of transplantation. (F) Analysis of the seroreactivity of serum samples from ten stable patients and 23 patients with AMVR toward 62 non-HLA antigens using single-antigen flow bead assays. The color of each box indicates the mean fluorescence intensity (MFI) of the reaction of the sample to an individual antigen. The thresholds for defining a positive reaction of the patients with to each individual antigen were calculated on the basis of the mean MFI of the control group of stable patients. Samples with an MFI less than the mean+3 SD were classified as negative and samples with an MFI greater than the mean+3 SD were classified as positive. The number of positive samples is provided on the right and the samples that reached the threshold for positivity are indicated with a cross.

