Figure 4.
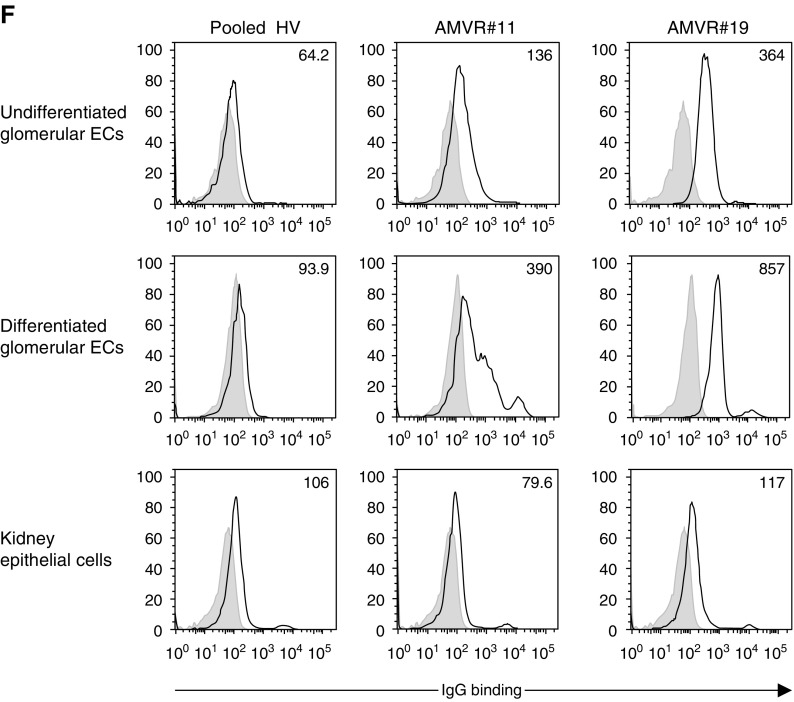
The seroreactivity against glomerular ECs was significantly increased in sera from patients with AMVR. Sera (diluted 1:4) were incubated with ECs. Antibody binding was detected using fluorescently labeled anti-human IgG, and the mean fluorescence intensity (MFI) was measured using flow cytometry. (A) Comparison of the reactivity of sera from healthy volunteers (HVs; n=6) and KTRs with (n=19) or without (n=10) early AMVR and without anti-HLA DSAs toward unstimulated immortalized human glomerular CiGEnCs. The data are presented as a fold increase in the MFI compared with a pool of AB serum samples used as negative control. The P value was calculated using the Kruskal–Wallis test. Asterisks depict significant differences in pairwise group comparisons calculated using Dunn posttest. ***P<0.01; ****P<0.001. (B) Sera (diluted 1:4) collected on the day of transplantation or at rejection from four patients with AMVR without anti-HLA DSAs were incubated with unstimulated microvascular CiGEnCs. Representative histograms showing IgG binding are shown; values indicate the geometric MFIs. (C) Serial dilutions of sera from patient AMVR#11 or a pool of HVs were incubated with renal microvascular CiGEnCs before the detection of antibody binding using anti-human IgG. Data are presented as the geometric MFIs. (D and E) Sera (diluted 1:4) collected on the day of transplantation from 19 patients with AMVR were incubated with (D) renal microvascular CiGEnCs or (E) primary cultures of macrovascular arterial ECs before (unstimulated) or after a 48-hour stimulation with TNF-α and IFN-γ. A pool of AB sera was used as a negative control (CTL). A cut-off of a two-fold increase in the geometric mean value of patients’ sera compared with the negative control was established to define reactive sera. (F) Sera (diluted 1:4) collected on the day of transplantation from two patients with early AMVR or a pool of serum samples from HVs (n=6) were incubated with renal microvascular ECs or epithelial cells. Microvascular ECs were used before or after in vitro differentiation. Representative histograms showing IgG binding are shown, and the values indicate the geometric MFIs.


