Figure 5.
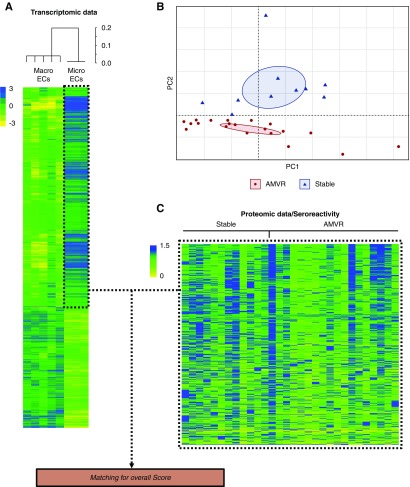
Integrated RNAseq-protein array analysis. (A) Unsupervised principal component analysis of the global seroreactivity profiles of serum samples collected immediately before transplantation from patients with AMVR (n=20) and stable KTRs (n=10). Average fixation signals of the immunogenic antigens were used. Ellipses of confidence (0.95) are presented for each group. (B) Clustering and heat map representations of the transcriptomic data from microvascular and macrovascular ECs. Cell samples (n=3 for microvascular ECs and n=5 for macrovascular ECs) are arranged along the x-axis and differentially expressed genes (n=3427) are arranged along the y-axis. The color of each cell reflects the fold change in the expression of each gene. (C) Heat map representation of the seroreactivity patterns of patients with AMVR and stable KTRs. Sera are arranged along the x-axis, whereas immunogenic antigens are arranged along the y-axis. The color of each cell reflects the normalized average fixation signal of an individual serum to one antigen.

