Fig. 2.
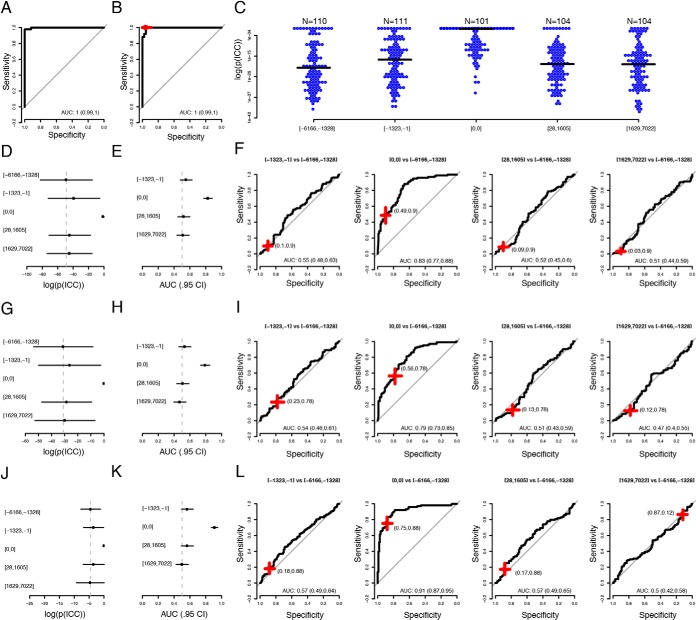
Multivariate analyses. A, Aggregated ROC-curve for the test-samples in the cross-validation training of the model using the full discovery data with 80 proteins. AUC given with 95% confidence interval. B, Performance of the trained model in the withheld discovery validation set. The red-cross represent the performance at the cut-off determined using the training data. C, Distribution of model-output (log(p)) when applied to the replication cohort in bins. The black line represents median value in each bin. D, Median (dot) and median absolute deviation (lines) of probabilities (model output) in the same bins as in (C). The dotted vertical line indicates the median in the bin with samples collected 6166 to 1328 days before diagnosis. E, AUCs for discriminations of the samples collected 6166 to 1328 days before diagnosis and the subsequent bins. Horizontal black lines indicate 95% confidence interval. The dotted vertical line indicates and AUC = 0.5. F, ROC-curves in the same bins as in (E). The red crosses indicate performance at the cut-off determined in the training proportion of the discovery data. The width and breadth of the cross represent 95% confidence interval of the sensitivity and specificity. G–I, Same as (D–F) but for the 11-protein signature. J–L, As (G–I) but for the 11-protein signature retrained as in (A–B) but with samples used for normalization in the replication cohort as controls and the samples taken at diagnosis in the replication cohort as cases.

