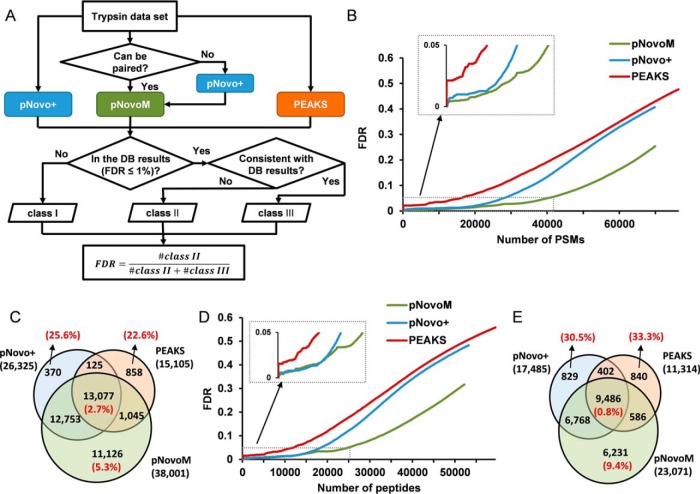
Fig. 4.
Proteome-level de novo sequencing of yeast based on the mirror protease strategy. A, Workflow for the de novo sequencing and FDR evaluation at the proteome level. B, FDR curves of pNovoM, pNovo+ and PEAKS at the spectrum level. C, Venn diagram of the spectra sequenced with pNovo+, PEAKS and pNovoM at 5% FDR at the spectrum level. The red numbers in parentheses denote the FDRs of the corresponding parts. D, FDR curves of pNovoM, pNovo+ and PEAKS at the peptide level. E, Venn diagram of the peptides sequenced using pNovo+, PEAKS and pNovoM at 5% FDR at the peptide level.

