Fig. 5.

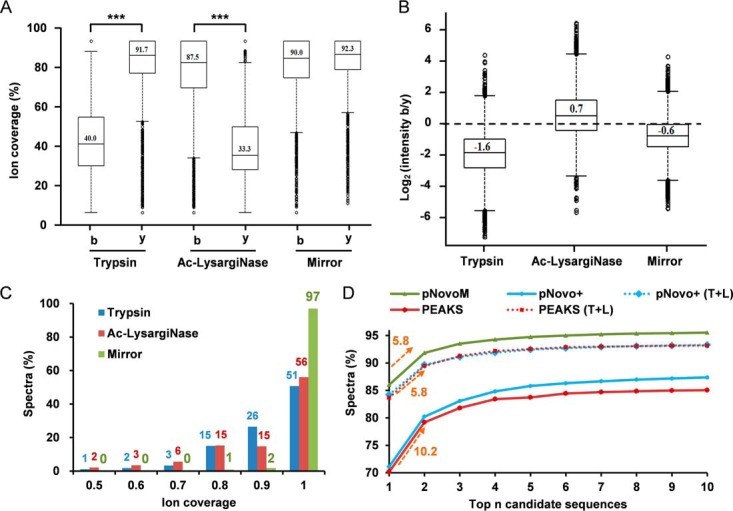
Mirror spectrum pairs achieved near-complete ion coverage. A, Percentages of matched b and y ions in trypsin, Ac-LysargiNase and mirror spectra. B, The distributions of the intensities of the matched b and y ions in trypsin, Ac-LysargiNase and mirror spectra. C, The distributions of ion coverage in trypsin, Ac-LysargiNase and mirror spectra. D, In all 16,514 mirror spectrum pairs, the cumulative curves of the number of correctly matched spectra from top one to top ten candidates of pNovoM, pNovo+, pNovo+ (T+L), PEAKS and PEAKS (T+L). (T+L) denotes that both trypsin and Ac-LysargiNase spectra were considered. Numbers below the arrows indicate the increase from the top one sensitivity to the top two sensitivity.
