Fig. 4.
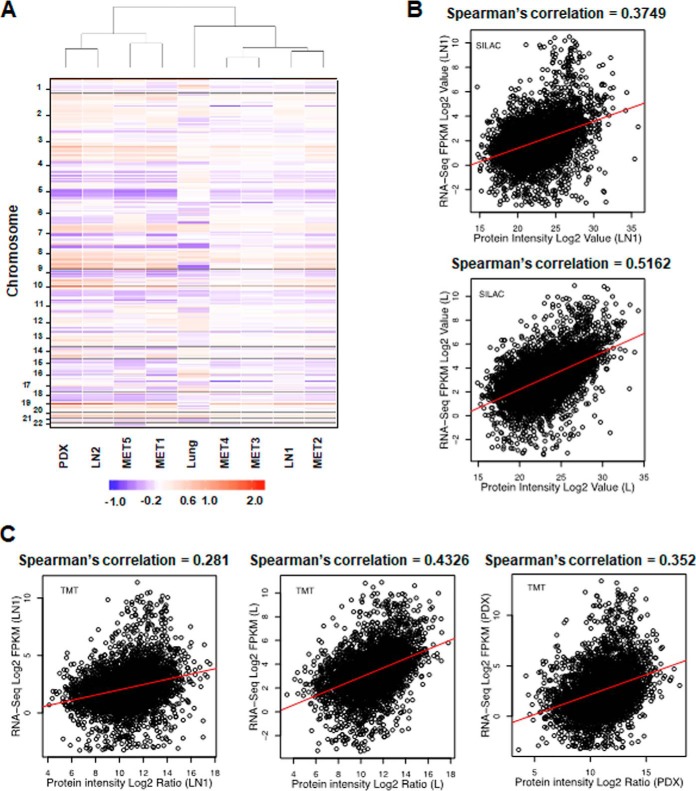
Heterogeneity in copy number alterations and correlation of RNA-seq and protein estimation data. A, Hierarchical clustering by copy number across the genome across all tumors (at cytoband resolution). Losses (purple) and gains (red) in log 2 scale are depicted relative to mean ploidy. B, Correlation between super-SILAC-derived proteome and RNA-seq results for LN1 and Lung metastases. X axis is the Log 2 intensity; Y axis is the Log 2 RPKM value. C, Correlation between TMT-derived proteome and RNA-seq results for LN1, Lung, and PDX samples. X axis is the Log 2 intensity; Y axis is the Log 2 RPKM value.

