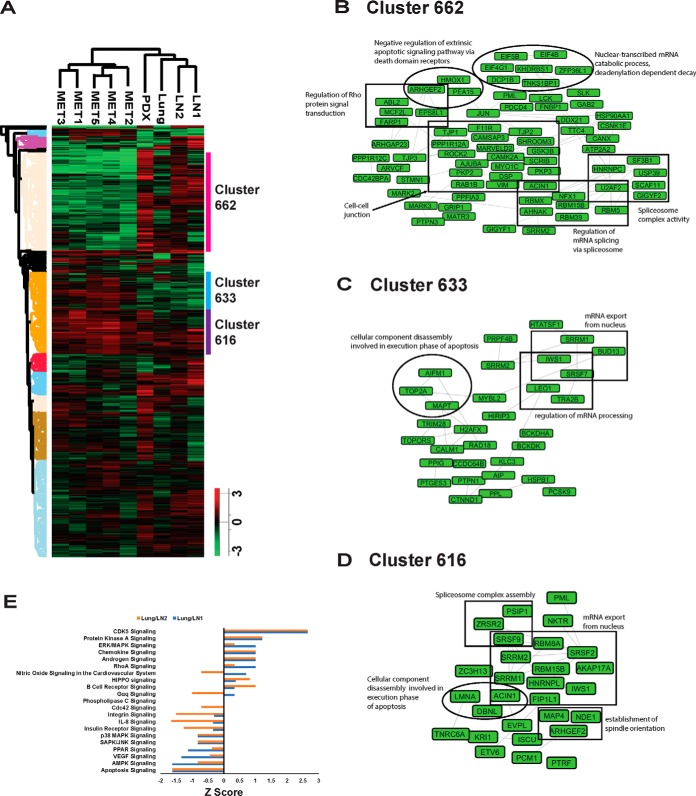
Fig. 5.
Comparison of lung and lymph node metastases phosphoproteomes. A, Hierarchical clustering of protein phosphorylation by tissue shows that autopsy samples are distinct from the other tissues. Columns represent different tissue samples. Rows represent quantified phosphosites. 3 clusters are highlighted and labeled. B, Network of the proteins from cluster 662. C, Network of the proteins from cluster 633. D, Network grouping of the proteins from cluster 616. E, Top canonical pathways represented by phosphosites changed between lung and either lymph node as determined by the TMT experiment. X-axis is the Z-score of the enriched pathways.

