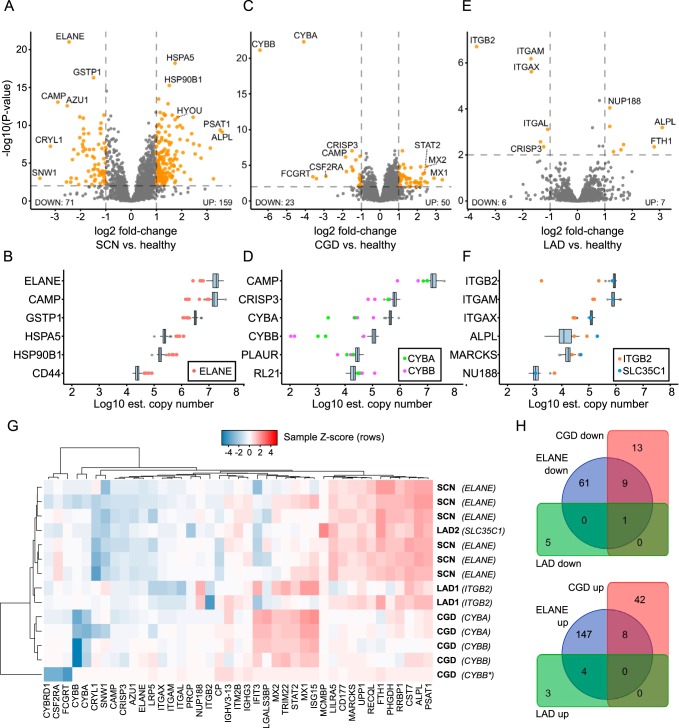
Fig. 3.
Differential protein expression in SCN, CGD and LAD. A, Volcano plot illustrating changes in neutrophil granulocyte protein expression between SCN-ELANE (n = 6) and healthy individuals (n = 68). X-axis showing log2 fold change compared with healthy control, Y-axis showing -log10(p value). A total of 71 proteins were significantly underexpressed in ELANE-mutant cells, 159 were significantly overexpressed. Points marked in orange have adjusted p values <0.01 and absolute fold-change >2. B, Top six significantly differentially expressed proteins in SCN, ordered by decreasing mean estimated log10 copy number. The differentially expressed proteins span four orders of magnitude of abundance. C, Differential protein analysis of CGD cases versus healthy individuals. The most downregulated proteins are members of the flavocytochrome b558 complex affected in CGD, namely CYBA and CYBB. Interferon-1-responsive network members (MX1, MX2, STAT2) were significantly up-regulated in CGD. Points marked in orange as in Fig. 3A. D, Top six significantly differentially expressed proteins in CGD, ordered by decreasing mean estimated log10 copy number. E, Differential protein analysis of LAD cases versus healthy control. Only modest proteome-level effects could be detected. The most downregulated proteins were integrins which are members of the affected protein family (ITGB2, ITGAM, ITGAX). F, Top six significantly differentially expressed proteins in LAD, ordered by decreasing mean estimated log10 copy number. G, Heatmap of protein expression levels in all analyzed cases normalized to expression in healthy individuals and z-transformed within each sample. Samples and proteins were ordered using hierarchical clustering. Dendrograms show relative Euclidean distances between samples or proteins. Samples tend to be clustered close together as expected by genetic analysis, except for the one LAD2 case. Very homogenous expression profiles can be seen for the six SCN samples and four CGD samples. CYBB*, CYBB splice donor variant. H, Venn diagram comparing differentially expressed proteins in SCN-ELANE, CGD, and LAD (note the low degree of overlap between diseases).

