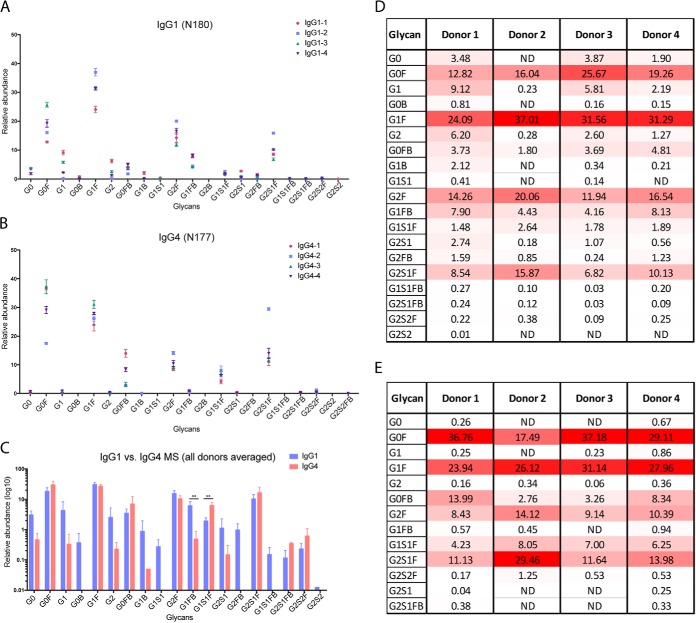
Fig. 2.
Comparison of Site-Specific IgG1 and IgG4 Fc N-Glycosylation using nLC-MS/MS. A, IgG1 Fc N-glycopeptide relative abundance, based on nLC-MS/MS analysis of IgG1 tryptic peptides. Immunoglobulin subclasses were isolated from a set of healthy donors (n = 4) and each sample was analyzed in triplicate. Glycopeptide assignments were made based on precursor m/z, peptide backbone fragment ions, carbohydrate fragment ions, and retention time. B, IgG4 Fc N-glycopeptide relative abundance, assigned as in (A). C, Comparison of IgG1 and IgG4 Fc N-glycopeptide relative abundance, based on glycoform. (Blue = IgG1, Red = IgG4) Differences in bisecting, fucosylated glycoforms and sialylated, fucosylated glycoforms are noted. ** indicates statistical significance (p < 0.001). D, Heat map of IgG1 glycoforms. E, Heat map of IgG4 glycoforms. The heat maps shows the N-glycosylation site, putative N-glycan, and average relative abundance (%) for each glycoform for donors 1–4. The heat map is scaled according to relative abundance for each donor sample, with the highest abundance glycoform in each sample colored red, the lowest colored white, and intermediate glycoforms colored on a linear intensity scale between the two extremes.

