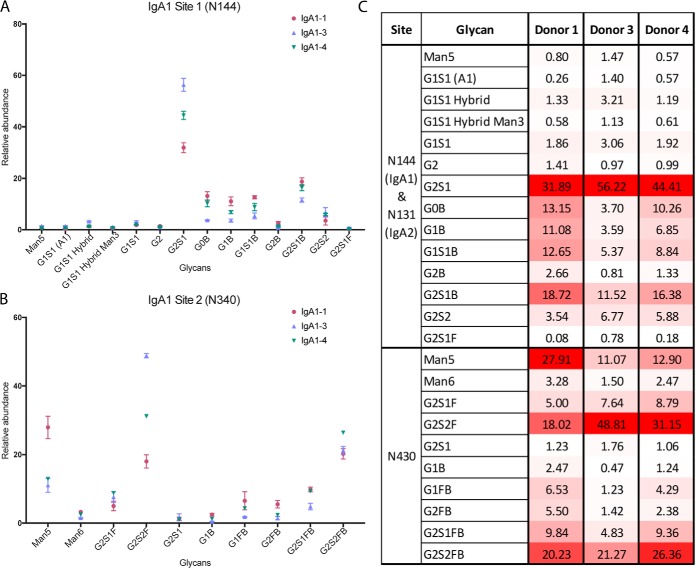
Fig. 4.
IgA1 Glycoforms at Sites N144 and N340. A, IgA1 site N144 N-glycopeptide relative abundance, based on nLC-MS/MS analysis of IgA1 site N144 trypsin/Glu-C peptides. Immunoglobulin subclasses were isolated from a set of healthy donors (n = 4) and each sample was analyzed in triplicate. Glycopeptide assignments were made based on precursor m/z, peptide backbone fragment ions, carbohydrate fragment ions, and retention time. B, IgA1 site N340 N-glycopeptide relative abundances, based on nLC-MS/MS analysis of IgA1 site N340 trypsin/Glu-C peptides. C, Heat map of IgA1 glycoforms. The heat map shows the N-glycosylation site, putative N-glycan, and average relative abundance (%) for each glycoform for donors 1, 3, and 4. Donor 2 was excluded, as an insufficient amount of IgA1 was isolated for glycopeptide detection. The heat map is scaled according to relative abundance for each donor sample, with the highest abundance glycoform at each site and within each sample colored red, the lowest colored white, and intermediate glycoforms colored on a linear intensity scale between the two extremes.

