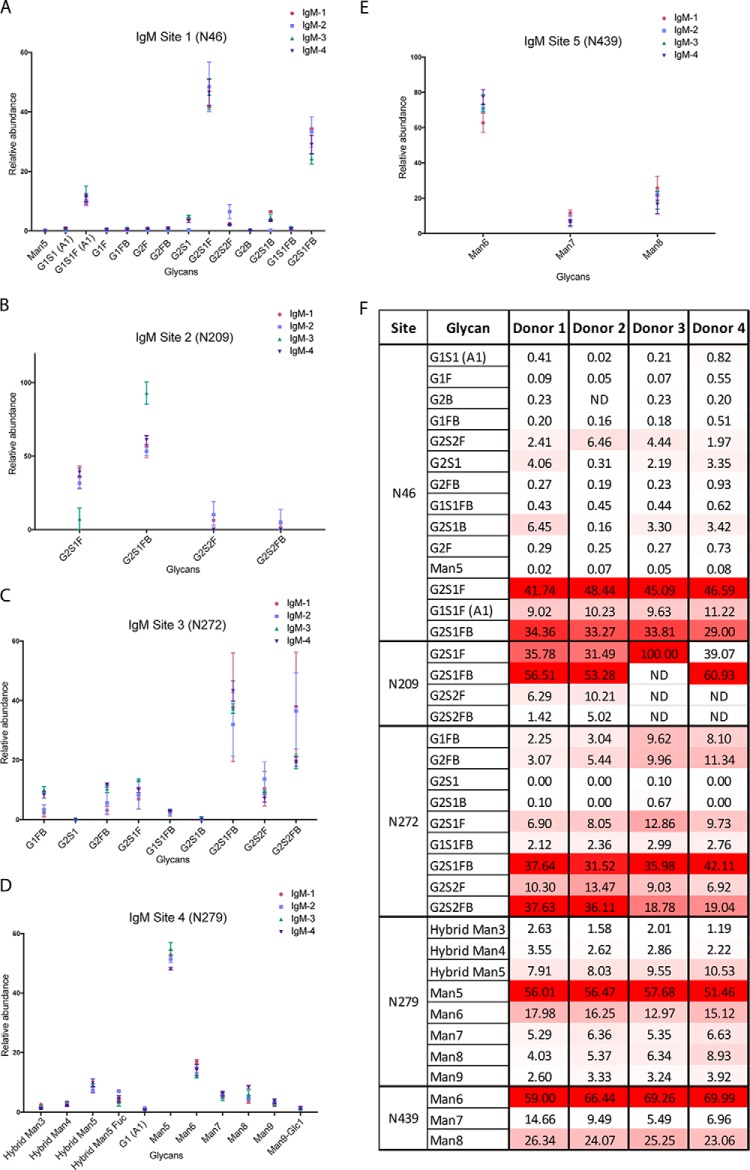
Fig. 6.
IgM Glycoforms at Sites N46, N209, N272, N279, and N439. A, IgM site N46 N-glycopeptide relative abundance. B, IgM site N209 N-glycopeptide relative abundance. C, IgM site N272 N-glycopeptide relative abundance. D, IgM site N279 N-glycopeptide relative abundance. E, IgM site N439 N-glycopeptide relative abundance. For all sites, abundances and standard deviation are shown for IgM from four healthy individuals, each run in triplicate. F, Heat map of IgM glycoforms. The heat map shows the N-glycosylation site, putative N-glycan, and average relative abundance (%) for each glycoform for donors 1–4. The heat map is scaled according to relative abundance for each donor sample, with the highest abundance glycoform at each site and within each sample colored red, the lowest colored white, and intermediate glycoforms colored on a linear intensity scale between the two extremes.

