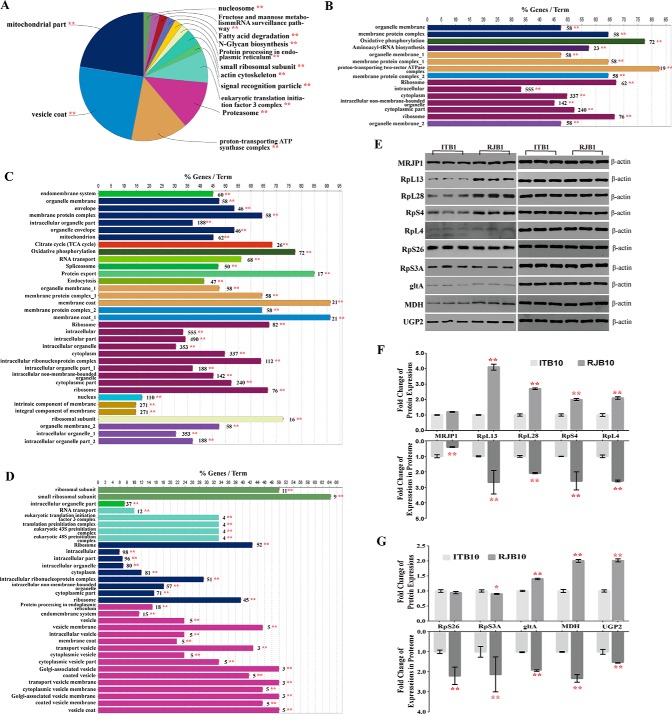
Fig. 6.
Comparisons of hypopharyngeal gland (HG) proteins in nurse bees (NBs) between Italian bees (ITBs) and high royal jelly producing bees (RJBs). A, B, and C, A qualitative comparison of identified HG proteins in NBs between ITBs and RJBs using ClueGO; The proteins identified in ITBs and RJBs are analyzed by ClueGO to compare the functional classes and pathways specifically enriched by two data sets. a, Pie chart overview of the significantly enriched functional classes and pathways shared by both ITB and RJB NBs; b and c, The unique functional classes and pathways significantly enriched by NBs of ITBs and RJBs, respectively. The details of the enrichment analysis results see supplemental Table S19. D, The enriched functional classes and pathways of quantitative comparison by upregulated proteins in NBs of RJBs relative to ITBs (fold change ≥ 2 and p < 0.05). The details of the enrichment analysis results see supplemental Table S21. % genes/Term stands for the proportion of genes enriched in corresponding functional groups. The bars with the same color present belong to the same functional groups. The numbers stand for the genes enriched to the corresponding functional groups. E, The different expressions of proteins in NBs between ITBs and RJBs tested by a western-blotting assay. Protein β-actin is used as a loading control. IT10, NBs of ITBs; RJ10, NBs of RJBs. F and G, The relative expression value of selected proteins; upside, the relative fold changes of selected protein expressions of the RJBs compared with ITBs tested by WB; downside, the fold changes of key proteins of the RJBs compared with ITBs calculated by label free quantification. Graph was the mean and S.D. *, p < 0.05; **, p < 0.01.

