Fig. 1.
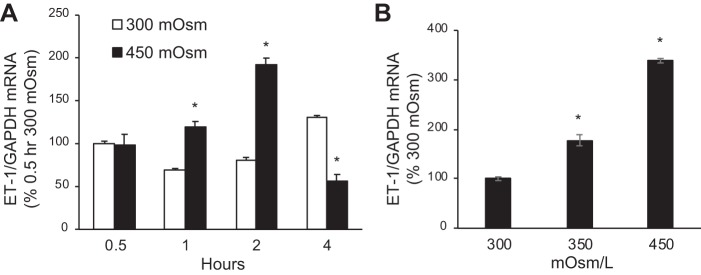
Time course (A) and dose response (B) of the effect of increasing osmolarity (using mannitol) on endothelin-1 (ET-1) mRNA content [normalized to glyceraldehyde-3-phosphate dehydrogenase (GAPDH) mRNA content] in inner medullary collecting duct (IMCD) 3 cells. The data points on the x-axis refer to the length of time confluent cells were exposed to 300 or 450 mosM; n = 6 for each data point. *P < 0.05 vs. 300 mosM at the same time point (A) or vs. 300 mosM (B).

