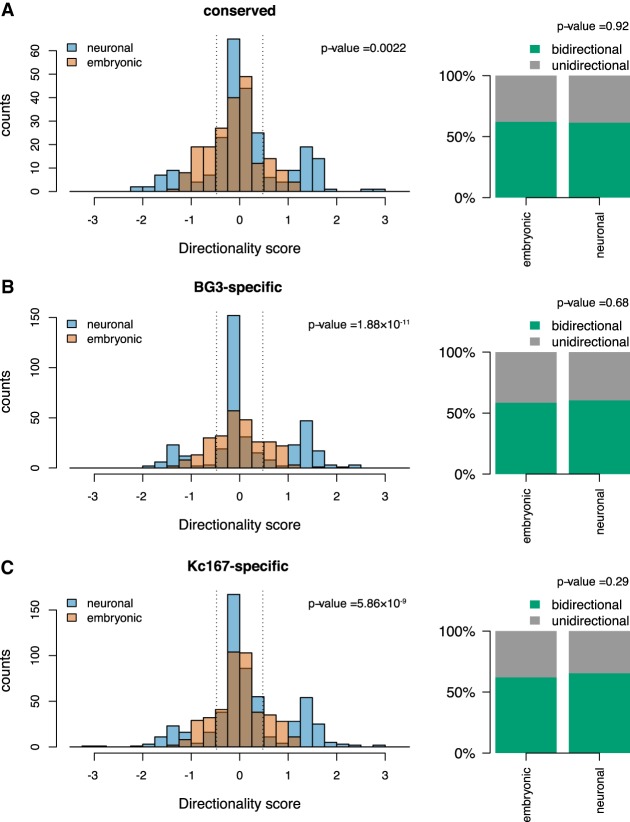
Figure 3.
Bidirectional transcription at TAD borders. Histograms representing the directionality score computed as log10 of the ratio between nascent RNA levels in 500 bp on the positive strand downstream from the border and on the negative strand upstream of the border; 500-bp bins that were 500 bp away were considered in both directions from the border. The barplot represents the percentage of TAD borders in which the directionality score was lower than 0.47 (dotted lines on the histogram, representing less than three times more transcription on one strand). We classified these borders as bidirectional borders. We used a Kolmogorov–Smirnov test to compare the change in distribution of bidirectionality score (see P-values) and a Fisher's exact test to compare if the change in number of bidirectional TAD borders is statistically significant (see P-values). (A) Conserved TAD borders; (B) BG3-specific TAD borders; and (C) Kc167-specific TAD borders.

