
Figure 6.
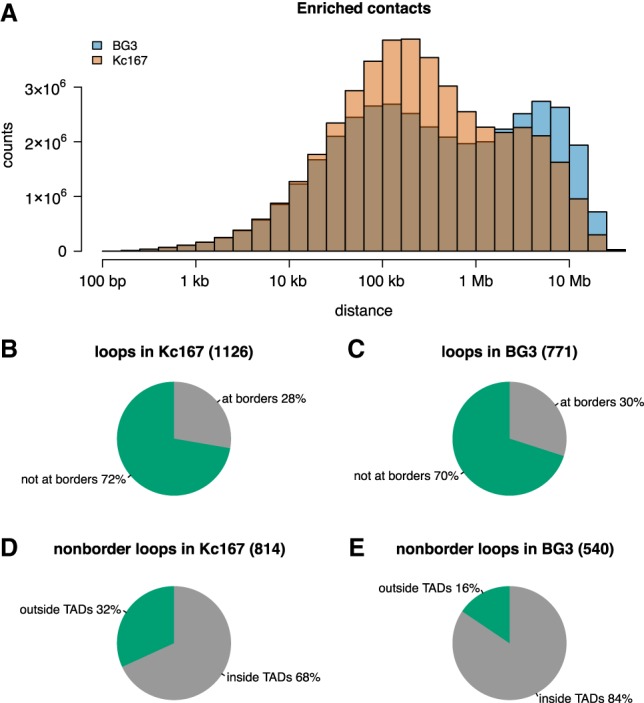
BG3 cells display more long-range interactions compared with Kc167 cells. (A) Histogram showing the distances between two anchors of enriched contacts in the contact matrices (for BG3 and Kc167 cells). To keep consistency, we considered the down-sampled Kc167 Hi-C map, which had the same number of interactions as the BG3 map. (B,C) Distribution of chromatin loops at the borders of TADs in Kc167 and BG3 cells, showing that both cells have similar number of loops at TAD borders (Fisher's exact test P-value = 0.3). (D,E) Distribution of nonborder chromatin loops within TADs or between TADs in Kc167 and BG3 cells, showing that Kc167 cells display more loops within TADs compared with BG3 cells (Fisher's exact test P-value = 6.61 × 10⁻¹²).