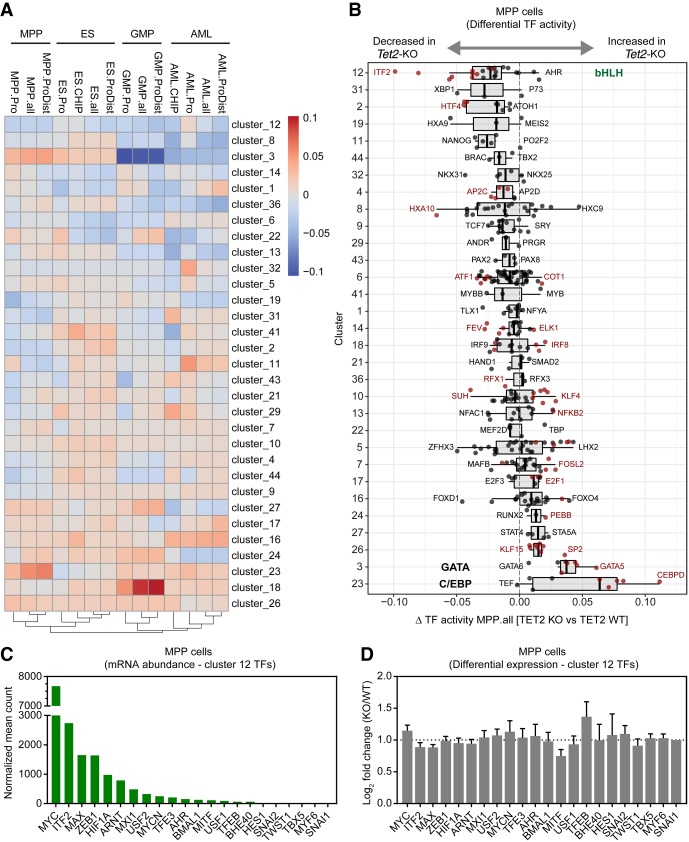
Figure 5.
Summary of diffTF analysis and ATAC-seq profiles of multiple cell types with loss of TET2. (A) The heatmap represents the summary of diffTF analyses between Tet2 knockout and wild type across multiple cell types. The color scale of the heatmap corresponds to the Z-scores of the weighted mean difference values (TF activity) obtained from diffTF. Negative values indicate that the TF cluster has lower activity in Tet2 knockout samples compared to the wild type, and vice versa for positive values. Only TF clusters with three or more TFs are shown. For each cell type, the analysis was run on different sets of peaks: promoter regions only (−1.5 kb/+500 bp from TSS; labeled celltype.Pro) and putative enhancer regions (+100 kb/−100 kb from TSS excluding promoter regions; celltype.ProDist), in addition to the full set of peaks (celltype.all). For the cell types for which we mapped TET2 binding sites by ChIP-seq (ES cells and AML cells), diffTF was also run using ATAC-seq peaks intersected with TET2 ChIP in the corresponding cell type (celltype.CHIP). TET2-bound regions in AML cells were determined in bulk AML cells (containing both the leukemic precursor population that was used for ATAC-seq analysis as well as more differentiated cells) (Supplemental Fig. S3B). (B) Box plot showing weighted mean difference values obtained from diffTF analyses for each TF cluster in MPP cells comparing Tet2 knockout versus wild type. Individual TFs within a cluster are shown (black dots), and TFs passing a significance threshold (P-value < 0.1) are highlighted (red dots). The predominant TF identity of selected clusters (12, 3, and 23) are marked. (C) Histogram showing mean normalized counts for Cluster 12 TFs obtained from RNA-seq data generated from wild-type and Tet2 knockout MPP cells (n = 4). The TFs within Cluster 12 are ranked based on mean normalized abundance. (D) DESeq2 differential expression values of Cluster 12 TFs ranked as in C. No statistically significant changes were observed (FDR < 0.05).

